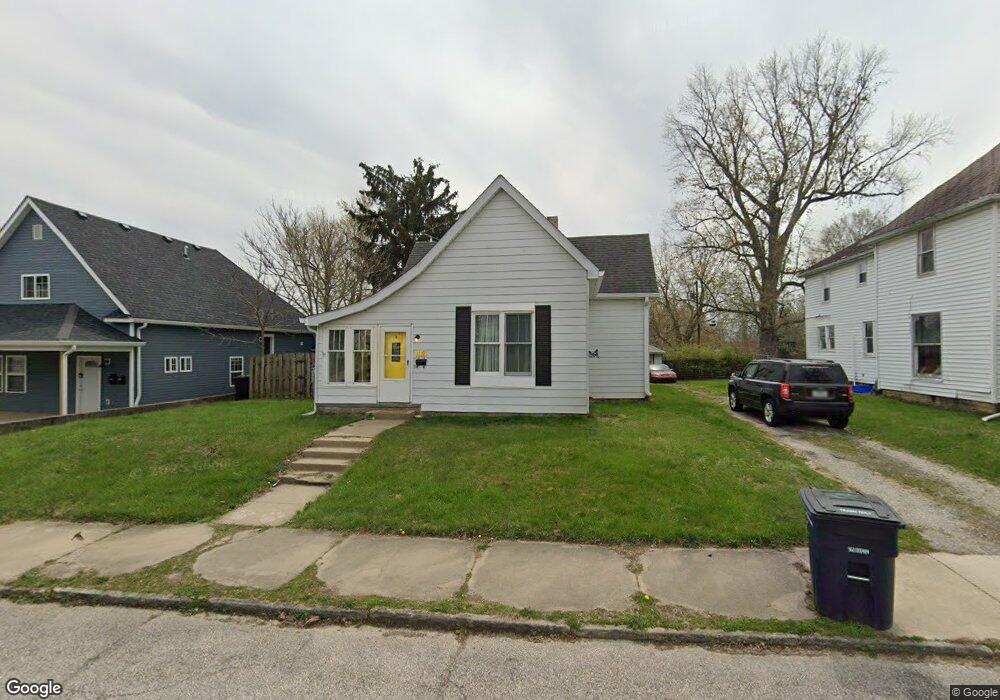
1119 S A St Elwood, IN 46036
Estimated Value: $129,000 - $160,000
3
Beds
2
Baths
1,144
Sq Ft
$125/Sq Ft
Est. Value
About This Home
This home is located at 1119 S A St, Elwood, IN 46036 and is currently estimated at $143,103, approximately $125 per square foot. 1119 S A St is a home located in Madison County with nearby schools including Elwood Elementary School, Elwood Intermediate School, and Elwood Junior-Senior High School.
Ownership History
Date
Name
Owned For
Owner Type
Purchase Details
Closed on
Jul 14, 2023
Sold by
Boyland Christy A and Israel Mary J
Bought by
Israel Mary J and Israel Christopher L
Current Estimated Value
Purchase Details
Closed on
Jan 16, 2010
Sold by
White Wendell L
Bought by
Israel Christopher L and Israel Mary J
Purchase Details
Closed on
Jan 16, 2008
Sold by
White Wendell L
Bought by
Jarael Mary J and Jarael Jared Christopher
Create a Home Valuation Report for This Property
The Home Valuation Report is an in-depth analysis detailing your home's value as well as a comparison with similar homes in the area
Home Values in the Area
Average Home Value in this Area
Purchase History
| Date | Buyer | Sale Price | Title Company |
|---|---|---|---|
| Israel Mary J | $50,000 | None Listed On Document | |
| Israel Christopher L | $62,800 | -- | |
| Jarael Mary J | $62,800 | -- |
Source: Public Records
Tax History Compared to Growth
Tax History
| Year | Tax Paid | Tax Assessment Tax Assessment Total Assessment is a certain percentage of the fair market value that is determined by local assessors to be the total taxable value of land and additions on the property. | Land | Improvement |
|---|---|---|---|---|
| 2025 | $1,590 | $79,500 | $12,500 | $67,000 |
| 2024 | $1,590 | $79,500 | $12,500 | $67,000 |
| 2023 | $732 | $73,200 | $11,900 | $61,300 |
| 2022 | $736 | $72,600 | $11,300 | $61,300 |
| 2021 | $672 | $67,200 | $11,300 | $55,900 |
| 2020 | $670 | $66,000 | $10,700 | $55,300 |
| 2019 | $653 | $64,300 | $10,700 | $53,600 |
| 2018 | $622 | $61,200 | $10,700 | $50,500 |
| 2017 | $605 | $60,500 | $10,700 | $49,800 |
| 2016 | $568 | $57,900 | $10,700 | $47,200 |
| 2014 | $512 | $57,000 | $10,700 | $46,300 |
| 2013 | $512 | $57,400 | $10,700 | $46,700 |
Source: Public Records
Map
Nearby Homes