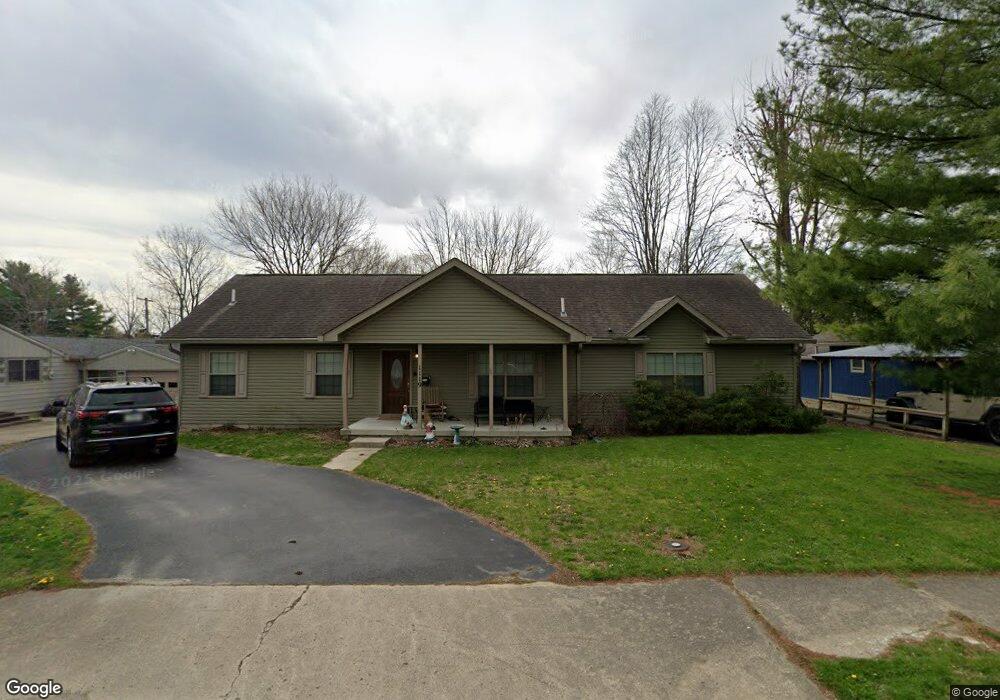
1119 S B St Elwood, IN 46036
Estimated Value: $150,000 - $242,000
3
Beds
2
Baths
1,736
Sq Ft
$104/Sq Ft
Est. Value
About This Home
This home is located at 1119 S B St, Elwood, IN 46036 and is currently estimated at $179,955, approximately $103 per square foot. 1119 S B St is a home located in Madison County with nearby schools including Elwood Elementary School, Elwood Intermediate School, and Elwood Junior-Senior High School.
Ownership History
Date
Name
Owned For
Owner Type
Purchase Details
Closed on
Feb 23, 2024
Sold by
Rebuck William D
Bought by
Guajardo Rosalio
Current Estimated Value
Home Financials for this Owner
Home Financials are based on the most recent Mortgage that was taken out on this home.
Original Mortgage
$162,181
Outstanding Balance
$159,025
Interest Rate
6.66%
Mortgage Type
VA
Estimated Equity
$20,930
Purchase Details
Closed on
Jan 18, 2016
Sold by
Rebuck Elizabeth J and Rebuck William
Bought by
Rebuck William D
Create a Home Valuation Report for This Property
The Home Valuation Report is an in-depth analysis detailing your home's value as well as a comparison with similar homes in the area
Home Values in the Area
Average Home Value in this Area
Purchase History
| Date | Buyer | Sale Price | Title Company |
|---|---|---|---|
| Guajardo Rosalio | -- | Fidelity National Title | |
| Rebuck William D | -- | -- |
Source: Public Records
Mortgage History
| Date | Status | Borrower | Loan Amount |
|---|---|---|---|
| Open | Guajardo Rosalio | $162,181 |
Source: Public Records
Tax History Compared to Growth
Tax History
| Year | Tax Paid | Tax Assessment Tax Assessment Total Assessment is a certain percentage of the fair market value that is determined by local assessors to be the total taxable value of land and additions on the property. | Land | Improvement |
|---|---|---|---|---|
| 2025 | -- | $82,700 | $7,900 | $74,800 |
| 2024 | $1,523 | $82,700 | $7,900 | $74,800 |
| 2023 | $1,523 | $75,900 | $7,500 | $68,400 |
| 2022 | $1,534 | $76,200 | $7,100 | $69,100 |
| 2021 | $1,417 | $70,600 | $7,100 | $63,500 |
| 2020 | $1,407 | $67,200 | $6,700 | $60,500 |
| 2019 | $1,384 | $66,100 | $6,700 | $59,400 |
| 2018 | $1,305 | $62,400 | $6,700 | $55,700 |
| 2017 | $1,296 | $62,200 | $6,700 | $55,500 |
| 2016 | $487 | $23,400 | $6,700 | $16,700 |
| 2014 | -- | $23,000 | $6,700 | $16,300 |
| 2013 | -- | $22,300 | $6,700 | $15,600 |
Source: Public Records
Map
Nearby Homes