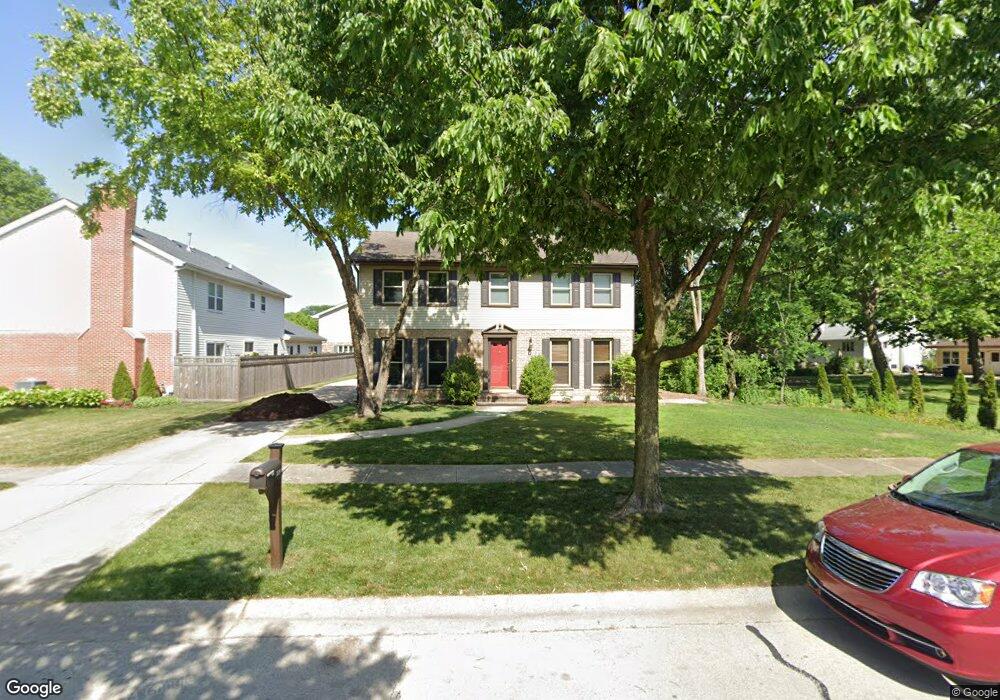
1119 S Oakland Ave Villa Park, IL 60181
Estimated Value: $560,095 - $685,000
--
Bed
--
Bath
2,406
Sq Ft
$258/Sq Ft
Est. Value
About This Home
This home is located at 1119 S Oakland Ave, Villa Park, IL 60181 and is currently estimated at $621,024, approximately $258 per square foot. 1119 S Oakland Ave is a home located in DuPage County with nearby schools including Salt Creek Elementary School, John E Albright Middle School, and Stella May Swartz Elementary School.
Ownership History
Date
Name
Owned For
Owner Type
Purchase Details
Closed on
May 4, 2021
Sold by
Lanenga Jacob John and Lanenga Deborah Lee
Bought by
Boerema Benjamin Bernard and Boerema Megan
Current Estimated Value
Home Financials for this Owner
Home Financials are based on the most recent Mortgage that was taken out on this home.
Original Mortgage
$360,000
Outstanding Balance
$325,740
Interest Rate
3%
Mortgage Type
New Conventional
Estimated Equity
$295,284
Create a Home Valuation Report for This Property
The Home Valuation Report is an in-depth analysis detailing your home's value as well as a comparison with similar homes in the area
Home Values in the Area
Average Home Value in this Area
Purchase History
| Date | Buyer | Sale Price | Title Company |
|---|---|---|---|
| Boerema Benjamin Bernard | $450,000 | Attorney |
Source: Public Records
Mortgage History
| Date | Status | Borrower | Loan Amount |
|---|---|---|---|
| Open | Boerema Benjamin Bernard | $360,000 |
Source: Public Records
Tax History Compared to Growth
Tax History
| Year | Tax Paid | Tax Assessment Tax Assessment Total Assessment is a certain percentage of the fair market value that is determined by local assessors to be the total taxable value of land and additions on the property. | Land | Improvement |
|---|---|---|---|---|
| 2024 | $9,313 | $167,325 | $27,608 | $139,717 |
| 2023 | $8,342 | $154,730 | $25,530 | $129,200 |
| 2022 | $8,046 | $148,740 | $24,540 | $124,200 |
| 2021 | $7,729 | $145,040 | $23,930 | $121,110 |
| 2020 | $7,563 | $141,870 | $23,410 | $118,460 |
| 2019 | $7,166 | $134,890 | $22,260 | $112,630 |
| 2018 | $7,049 | $126,420 | $20,860 | $105,560 |
| 2017 | $6,888 | $120,470 | $19,880 | $100,590 |
| 2016 | $6,344 | $113,490 | $18,730 | $94,760 |
| 2015 | $6,236 | $105,730 | $17,450 | $88,280 |
| 2014 | $6,127 | $98,030 | $31,280 | $66,750 |
| 2013 | $5,742 | $99,410 | $31,720 | $67,690 |
Source: Public Records
Map
Nearby Homes
- 625 E Van Buren St
- 650 E Van Buren St
- 1046 E Van Buren St
- 0S639 Summit Ave
- 818 S Villa Ave
- 727 S Oakland Ave
- 2 Ardmore Ave
- 639 S Oakland Ave
- 633 S Monterey Ave
- 769 S Fairview Ave
- 1500 S Ardmore Ave Unit 408
- 412 E Washington St
- 613 S Summit Ave
- 604 S Grant Ave
- 740 S Berkley Ave
- 4 Waldorf Ct
- 722 S Berkley Ave
- 816 S Spring Rd
- 1S325 Buttercup Ln
- 963 S Saylor Ave
- 1115 S Oakland Ave
- 511 Calduto Cir
- 500 E Lane Dr
- 515 Calduto Cir
- 520 E Lane Dr
- 1107 S Oakland Ave
- 1112 S Oakland Ave
- 1120 S Oakland Ave
- 1116 S Oakland Ave
- 519 Calduto Cir
- 510 Calduto Cir
- 1200 S Oakland Ave
- 540 E Lane Dr
- 1108 S Oakland Ave
- 1103 S Oakland Ave
- 514 Calduto Cir
- 1004 S Oakland Ave
- 1104 S Oakland Ave
- 1210 S Oakland Ave
- 518 Calduto Cir