Estimated Value: $370,000 - $401,764
3
Beds
1
Bath
1,163
Sq Ft
$333/Sq Ft
Est. Value
About This Home
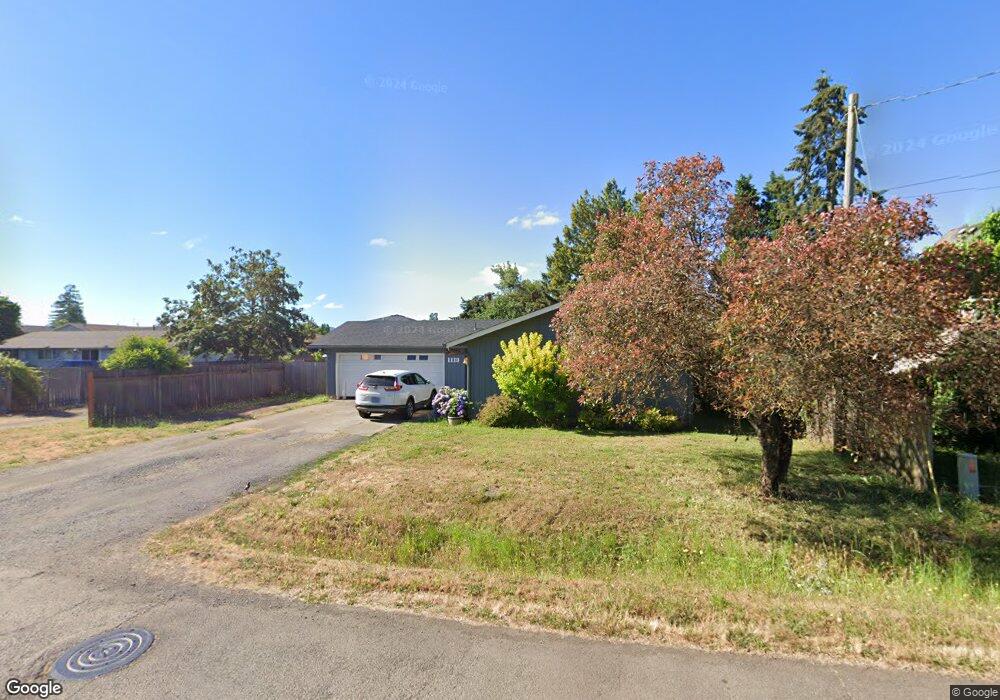
This home is located at 1119 S St, Springfield, OR 97477 and is currently estimated at $387,191, approximately $332 per square foot. 1119 S St is a home located in Lane County with nearby schools including Elizabeth Page Elementary School, Briggs Middle School, and Springfield High School.
Ownership History
Date
Name
Owned For
Owner Type
Purchase Details
Closed on
Aug 22, 2012
Sold by
Collier Jacob E and Collier Ashley A
Bought by
Collier Jacob E and Collier Ashley A
Current Estimated Value
Purchase Details
Closed on
Feb 13, 2008
Sold by
Dumbrow Reuben E and Dumbrow Trischa A
Bought by
Collier Jacob E and Mclaws Ashley A
Home Financials for this Owner
Home Financials are based on the most recent Mortgage that was taken out on this home.
Original Mortgage
$185,500
Outstanding Balance
$116,357
Interest Rate
6.04%
Mortgage Type
Purchase Money Mortgage
Estimated Equity
$270,834
Purchase Details
Closed on
Jul 13, 2005
Sold by
Anderson Laura S
Bought by
Dumbrow Reuben E and Dumbrow Trischa A
Home Financials for this Owner
Home Financials are based on the most recent Mortgage that was taken out on this home.
Original Mortgage
$32,550
Interest Rate
5.12%
Mortgage Type
Stand Alone Second
Create a Home Valuation Report for This Property
The Home Valuation Report is an in-depth analysis detailing your home's value as well as a comparison with similar homes in the area
Home Values in the Area
Average Home Value in this Area
Purchase History
| Date | Buyer | Sale Price | Title Company |
|---|---|---|---|
| Collier Jacob E | -- | Evergreen Land Title | |
| Collier Jacob E | $185,500 | Western Title | |
| Dumbrow Reuben E | $162,890 | Western Title & Escrow Compa |
Source: Public Records
Mortgage History
| Date | Status | Borrower | Loan Amount |
|---|---|---|---|
| Open | Collier Jacob E | $185,500 | |
| Previous Owner | Dumbrow Reuben E | $32,550 | |
| Previous Owner | Dumbrow Reuben E | $130,300 |
Source: Public Records
Tax History
| Year | Tax Paid | Tax Assessment Tax Assessment Total Assessment is a certain percentage of the fair market value that is determined by local assessors to be the total taxable value of land and additions on the property. | Land | Improvement |
|---|---|---|---|---|
| 2025 | $3,785 | $206,431 | -- | -- |
| 2024 | $3,724 | $200,419 | -- | -- |
| 2023 | $3,724 | $194,582 | $0 | $0 |
| 2022 | $3,449 | $188,915 | $0 | $0 |
| 2021 | $3,387 | $183,413 | $0 | $0 |
| 2020 | $3,099 | $167,811 | $0 | $0 |
| 2019 | $3,006 | $162,924 | $0 | $0 |
| 2018 | $2,833 | $153,572 | $0 | $0 |
| 2017 | $2,724 | $153,572 | $0 | $0 |
| 2016 | $2,667 | $149,099 | $0 | $0 |
| 2015 | $2,591 | $144,756 | $0 | $0 |
| 2014 | $2,552 | $140,540 | $0 | $0 |
Source: Public Records
Map
Nearby Homes
Your Personal Tour Guide
Ask me questions while you tour the home.