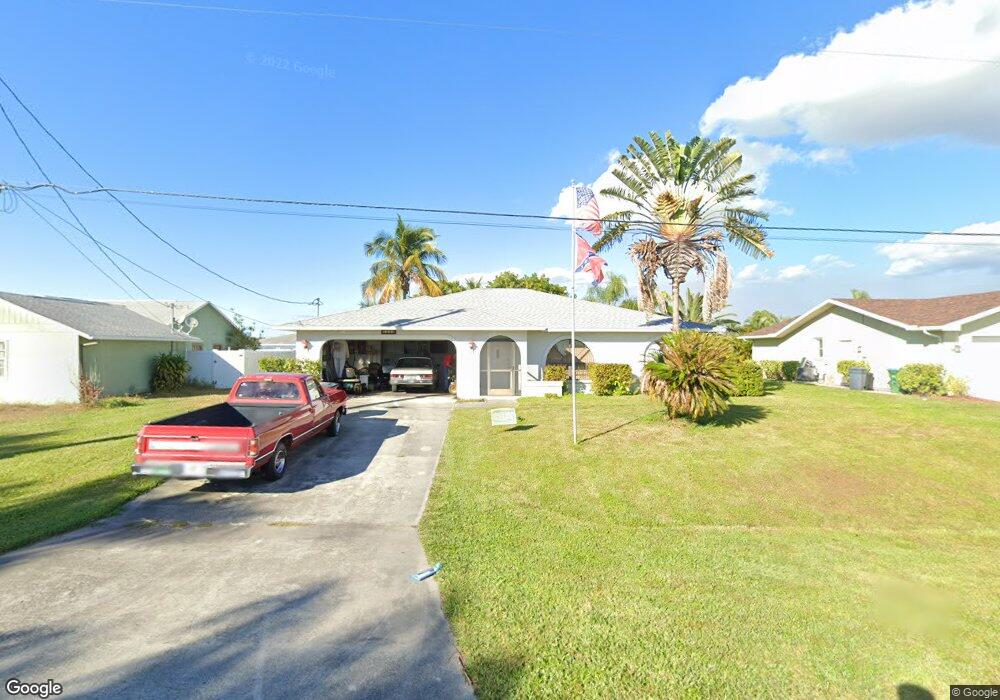
1119 SE 29th St Unit 53 Cape Coral, FL 33904
Caloosahatchee NeighborhoodEstimated Value: $258,000 - $346,000
3
Beds
2
Baths
1,693
Sq Ft
$170/Sq Ft
Est. Value
About This Home
This home is located at 1119 SE 29th St Unit 53, Cape Coral, FL 33904 and is currently estimated at $287,058, approximately $169 per square foot. 1119 SE 29th St Unit 53 is a home located in Lee County with nearby schools including Cape Elementary School, Caloosa Elementary School, and Tropic Isles Elementary School.
Ownership History
Date
Name
Owned For
Owner Type
Purchase Details
Closed on
Dec 2, 2024
Sold by
Platt Luanne B and Blue Matthew V
Bought by
Dennis Amy Irene and Dennis Robert J
Current Estimated Value
Home Financials for this Owner
Home Financials are based on the most recent Mortgage that was taken out on this home.
Original Mortgage
$137,500
Outstanding Balance
$136,365
Interest Rate
6.54%
Mortgage Type
New Conventional
Estimated Equity
$150,693
Purchase Details
Closed on
Nov 11, 1993
Sold by
Blue Dick L and Blue Berniece
Bought by
Blue Dick L
Home Financials for this Owner
Home Financials are based on the most recent Mortgage that was taken out on this home.
Original Mortgage
$63,000
Interest Rate
7.07%
Purchase Details
Closed on
Oct 29, 1993
Sold by
Keleigh Royse
Bought by
Blue Dick L and Blue Berniece
Home Financials for this Owner
Home Financials are based on the most recent Mortgage that was taken out on this home.
Original Mortgage
$63,000
Interest Rate
7.07%
Create a Home Valuation Report for This Property
The Home Valuation Report is an in-depth analysis detailing your home's value as well as a comparison with similar homes in the area
Home Values in the Area
Average Home Value in this Area
Purchase History
| Date | Buyer | Sale Price | Title Company |
|---|---|---|---|
| Dennis Amy Irene | $275,000 | Title Professionals | |
| Dennis Amy Irene | $275,000 | Title Professionals | |
| Blue Dick L | -- | -- | |
| Blue Dick L | $70,000 | -- |
Source: Public Records
Mortgage History
| Date | Status | Borrower | Loan Amount |
|---|---|---|---|
| Open | Dennis Amy Irene | $137,500 | |
| Closed | Dennis Amy Irene | $137,500 | |
| Previous Owner | Blue Dick L | $63,000 |
Source: Public Records
Tax History Compared to Growth
Tax History
| Year | Tax Paid | Tax Assessment Tax Assessment Total Assessment is a certain percentage of the fair market value that is determined by local assessors to be the total taxable value of land and additions on the property. | Land | Improvement |
|---|---|---|---|---|
| 2025 | $4,777 | $231,027 | $108,205 | $122,822 |
| 2024 | $4,777 | $251,497 | $59,543 | $191,954 |
| 2023 | $1,436 | $82,111 | $0 | $0 |
| 2022 | $1,266 | $79,719 | $0 | $0 |
| 2021 | $1,197 | $169,380 | $30,000 | $139,380 |
| 2020 | $1,174 | $76,328 | $0 | $0 |
| 2019 | $1,130 | $74,612 | $0 | $0 |
| 2018 | $1,120 | $73,221 | $0 | $0 |
| 2017 | $1,117 | $71,715 | $0 | $0 |
| 2016 | $788 | $117,385 | $19,000 | $98,385 |
| 2015 | $762 | $103,104 | $15,300 | $87,804 |
| 2014 | $687 | $95,909 | $13,700 | $82,209 |
| 2013 | -- | $84,701 | $9,800 | $74,901 |
Source: Public Records
Map
Nearby Homes
- 2916 SE 11th Ave
- 1120 SE 29th Terrace
- 2941 SE 10th Place
- 1120 SE 30th St
- 2717 Shelby Pkwy
- 1115 SE 30th Terrace
- 1207 SE 27th Terrace
- 2614 SE 12th Place
- 1112 SE 31st St
- 1218 SE 30th Terrace
- 1313 Shelby Pkwy
- 1216 SE 27th St
- 1220 SE 27th St
- 2807 Country Club Blvd
- 248 SE 31st Terrace
- 324 SE 30th St
- 1421 SE 29th Terrace
- 2540 Shelby Pkwy
- 1414 Shelby Pkwy
- 1136 SE 32nd St
- 1123 SE 29th St
- 1115 SE 29th St
- 1130 SE 28th Terrace
- 1134 SE 28th Terrace
- 1126 SE 28th Terrace
- 1118 SE 29th St
- 1129 SE 29th St
- 1124 SE 29th St
- 1114 SE 29th St
- 1138 SE 28th Terrace
- 1107 SE 29th St
- 1118 SE 28th Terrace
- 1108 SE 29th Terrace
- 1128 SE 29th St
- 1128 SE 29th St Unit 14 + 15
- 1108 SE 29th St
- 1142 SE 28th Terrace
- 1133 SE 29th St
- 1129 SE 28th Terrace
- 1133 SE 28th Terrace