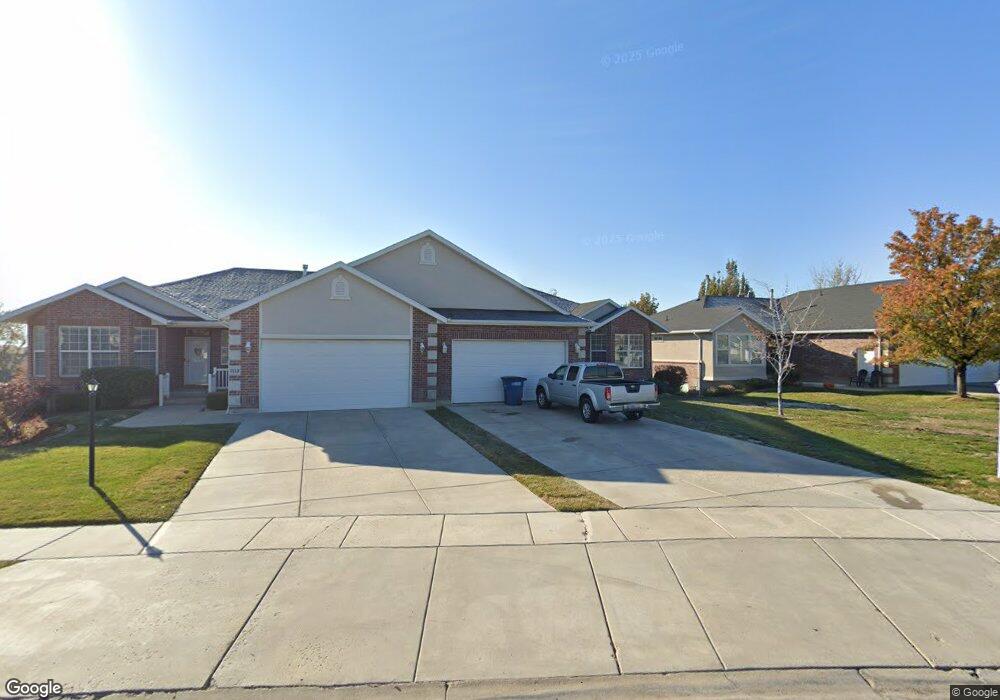
1119 Spring Creek Dr Layton, UT 84041
Estimated Value: $361,000 - $493,000
2
Beds
3
Baths
3,017
Sq Ft
$145/Sq Ft
Est. Value
About This Home
This home is located at 1119 Spring Creek Dr, Layton, UT 84041 and is currently estimated at $436,609, approximately $144 per square foot. 1119 Spring Creek Dr is a home located in Davis County with nearby schools including Lincoln Elementary School, North Layton Junior High School, and Northridge High School.
Ownership History
Date
Name
Owned For
Owner Type
Purchase Details
Closed on
May 18, 2004
Sold by
Bank Of Utah
Bought by
Kotter Linda
Current Estimated Value
Home Financials for this Owner
Home Financials are based on the most recent Mortgage that was taken out on this home.
Original Mortgage
$147,920
Outstanding Balance
$81,232
Interest Rate
8%
Mortgage Type
Purchase Money Mortgage
Estimated Equity
$355,377
Purchase Details
Closed on
Oct 28, 2003
Sold by
Willow Bend Inc
Bought by
Bank Of Utah
Purchase Details
Closed on
Jul 24, 2003
Sold by
Willow Bend Inc
Bought by
Thurgood Lorri E
Purchase Details
Closed on
Jun 25, 2001
Sold by
Spring Creek Development Corp
Bought by
Willow Bend Inc and Thurgood Denis R
Home Financials for this Owner
Home Financials are based on the most recent Mortgage that was taken out on this home.
Original Mortgage
$169,600
Interest Rate
7.14%
Create a Home Valuation Report for This Property
The Home Valuation Report is an in-depth analysis detailing your home's value as well as a comparison with similar homes in the area
Home Values in the Area
Average Home Value in this Area
Purchase History
| Date | Buyer | Sale Price | Title Company |
|---|---|---|---|
| Kotter Linda | -- | Bonneville Title Company Inc | |
| Bank Of Utah | -- | -- | |
| Thurgood Lorri E | -- | -- | |
| Willow Bend Inc | -- | Mountain View Title & Escrow |
Source: Public Records
Mortgage History
| Date | Status | Borrower | Loan Amount |
|---|---|---|---|
| Open | Kotter Linda | $147,920 | |
| Previous Owner | Willow Bend Inc | $169,600 |
Source: Public Records
Tax History Compared to Growth
Tax History
| Year | Tax Paid | Tax Assessment Tax Assessment Total Assessment is a certain percentage of the fair market value that is determined by local assessors to be the total taxable value of land and additions on the property. | Land | Improvement |
|---|---|---|---|---|
| 2024 | $2,127 | $224,950 | $52,250 | $172,700 |
| 2023 | $2,227 | $415,000 | $91,000 | $324,000 |
| 2022 | $2,402 | $243,100 | $45,650 | $197,450 |
| 2021 | $2,213 | $334,000 | $69,000 | $265,000 |
| 2020 | $2,051 | $297,000 | $51,000 | $246,000 |
| 2019 | $2,023 | $287,000 | $49,000 | $238,000 |
| 2018 | $1,791 | $255,000 | $49,000 | $206,000 |
| 2016 | $1,602 | $117,700 | $26,950 | $90,750 |
| 2015 | $1,492 | $104,060 | $26,950 | $77,110 |
| 2014 | $1,597 | $113,899 | $18,333 | $95,566 |
| 2013 | -- | $96,302 | $42,911 | $53,391 |
Source: Public Records
Map
Nearby Homes
- 781 W 2150 N
- 2402 N 725 W
- 2378 N 675 W
- 2211 N 525 W
- 1606 W 1960 N
- 1094 N Angel St W
- 1413 W 1650 N
- 1665 W 1960 N
- 2187 N 450 W
- 1615 N Angel St Unit E
- 1615 N Angel St Unit H
- 1615 N Angel St Unit I
- 1615 N Angel St Unit F
- 1615 N Angel St Unit G
- 1615 N Angel St
- 1615 N Angel St Unit D
- 1615 N Angel St Unit C
- 1615 N Angel St Unit B
- 1615 N Angel St Unit A
- 2887 N 1175 W
- 1113 Spring Creek Dr
- 1127 Spring Creek Dr
- 1133 Spring Creek Dr
- 2233 N 1100 W
- 2222 N 1150 W
- 2245 Spring Creek Dr
- 2224 N 1150 W
- 2262 Spring Creek Dr
- 2251 Spring Creek Dr
- 2257 N 1085 W Unit 47
- 2257 N 1085 W
- 2219 N 1100 W
- 1073 W 2250 N
- 2266 Spring Creek Dr
- 2263 Spring Creek Dr
- 2265 N 1085 W Unit 48
- 2265 N 1085 W Unit 47
- 2265 N 1085 W
- 2234 N 1100 W
- 2267 Spring Creek Dr