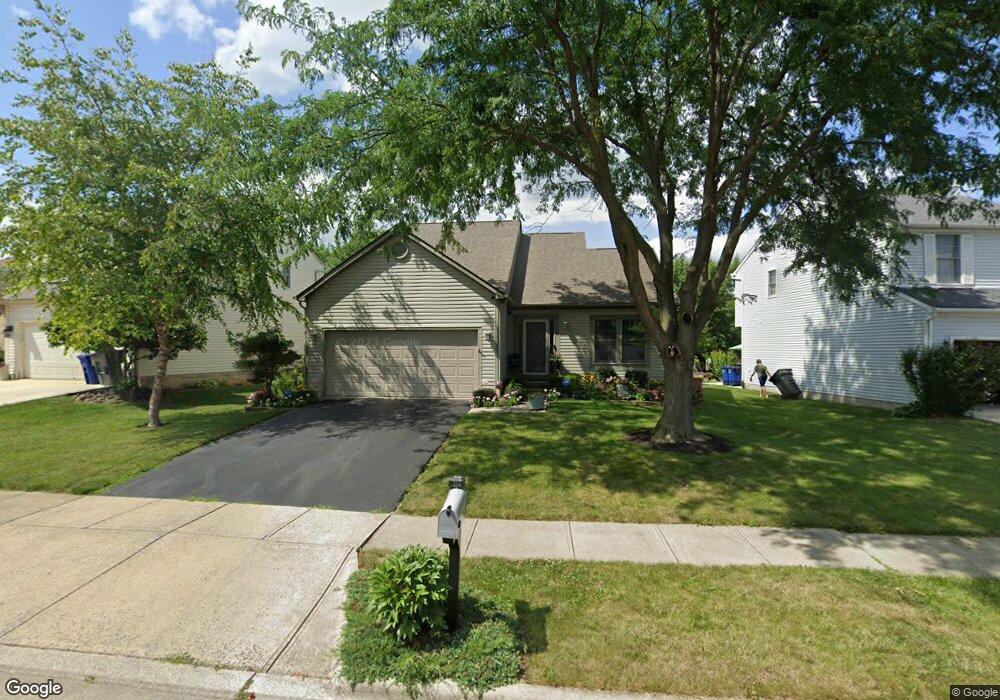
1119 Tenagra Way Columbus, OH 43228
Trabue Woods NeighborhoodEstimated Value: $355,000 - $365,000
3
Beds
2
Baths
1,740
Sq Ft
$207/Sq Ft
Est. Value
About This Home
This home is located at 1119 Tenagra Way, Columbus, OH 43228 and is currently estimated at $360,311, approximately $207 per square foot. 1119 Tenagra Way is a home located in Franklin County with nearby schools including Galloway Ridge Intermediate School, Prairie Lincoln Elementary School, and Norton Middle School.
Ownership History
Date
Name
Owned For
Owner Type
Purchase Details
Closed on
Mar 20, 2008
Sold by
Minturn Robert L and Do Cattien H
Bought by
Kelly Michael O and Straughn Brian E
Current Estimated Value
Home Financials for this Owner
Home Financials are based on the most recent Mortgage that was taken out on this home.
Original Mortgage
$157,255
Outstanding Balance
$97,967
Interest Rate
5.74%
Mortgage Type
FHA
Estimated Equity
$262,344
Purchase Details
Closed on
Jun 16, 1999
Sold by
Dominion Homes Inc
Bought by
Minturn Robert L and Do Cattien H
Home Financials for this Owner
Home Financials are based on the most recent Mortgage that was taken out on this home.
Original Mortgage
$146,422
Interest Rate
7.06%
Mortgage Type
FHA
Create a Home Valuation Report for This Property
The Home Valuation Report is an in-depth analysis detailing your home's value as well as a comparison with similar homes in the area
Home Values in the Area
Average Home Value in this Area
Purchase History
| Date | Buyer | Sale Price | Title Company |
|---|---|---|---|
| Kelly Michael O | $158,500 | Ohio Title | |
| Minturn Robert L | $147,100 | Alliance Tittle |
Source: Public Records
Mortgage History
| Date | Status | Borrower | Loan Amount |
|---|---|---|---|
| Open | Kelly Michael O | $157,255 | |
| Previous Owner | Minturn Robert L | $146,422 |
Source: Public Records
Tax History Compared to Growth
Tax History
| Year | Tax Paid | Tax Assessment Tax Assessment Total Assessment is a certain percentage of the fair market value that is determined by local assessors to be the total taxable value of land and additions on the property. | Land | Improvement |
|---|---|---|---|---|
| 2024 | $3,777 | $103,600 | $29,050 | $74,550 |
| 2023 | $3,711 | $103,600 | $29,050 | $74,550 |
| 2022 | $3,493 | $71,580 | $13,130 | $58,450 |
| 2021 | $3,564 | $71,580 | $13,130 | $58,450 |
| 2020 | $3,543 | $71,580 | $13,130 | $58,450 |
| 2019 | $3,157 | $56,280 | $10,500 | $45,780 |
| 2018 | $3,188 | $56,280 | $10,500 | $45,780 |
| 2017 | $3,128 | $56,280 | $10,500 | $45,780 |
| 2016 | $3,234 | $53,450 | $9,280 | $44,170 |
| 2015 | $3,234 | $53,450 | $9,280 | $44,170 |
| 2014 | $3,237 | $53,450 | $9,280 | $44,170 |
| 2013 | $1,605 | $53,445 | $9,275 | $44,170 |
Source: Public Records
Map
Nearby Homes
- 4451 Sherwill Rd
- 1175 Onaway Ct
- 4000 Sandy Ridge Dr
- 3761 Gibbstone Dr
- 4589 Annhurst Rd
- 3757 Gibbstone Dr
- 3664 Grimes Dr
- 3570 Dover Rd
- 271 Carilla Ln
- 218 Darbyhurst Rd
- 3495 La Coste Ln
- 450 Lawrence Ave
- 316 Sturbridge Rd
- 141 Beacon Run W Unit 26E
- 1024 Hartford Village Blvd Unit 1024
- 2051 Tuckaway Ct
- 4696 Tarryton Ct S Unit 7-2D
- 1152 Kinneton Unit 1152
- 960 Hartford Village Blvd
- 664 N Wilson Rd
- 1103 Tenagra Way
- 1127 Tenagra Way
- 1095 Tenagra Way
- 1143 Tenagra Way
- 1309 Sandrell Dr
- 1300 Faunsdale Dr
- 1120 Tenagra Way
- 1112 Tenagra Way
- 1087 Tenagra Way
- 1151 Tenagra Way
- 1315 Sandrell Dr
- 1306 Faunsdale Dr
- 1104 Mullens Ct
- 1079 Tenagra Way
- 1167 Tenagra Way
- 1321 Sandrell Dr
- 1312 Faunsdale Dr
- 1128 Tenagra Way
- 1136 Tenagra Way
- 1144 Tenagra Way