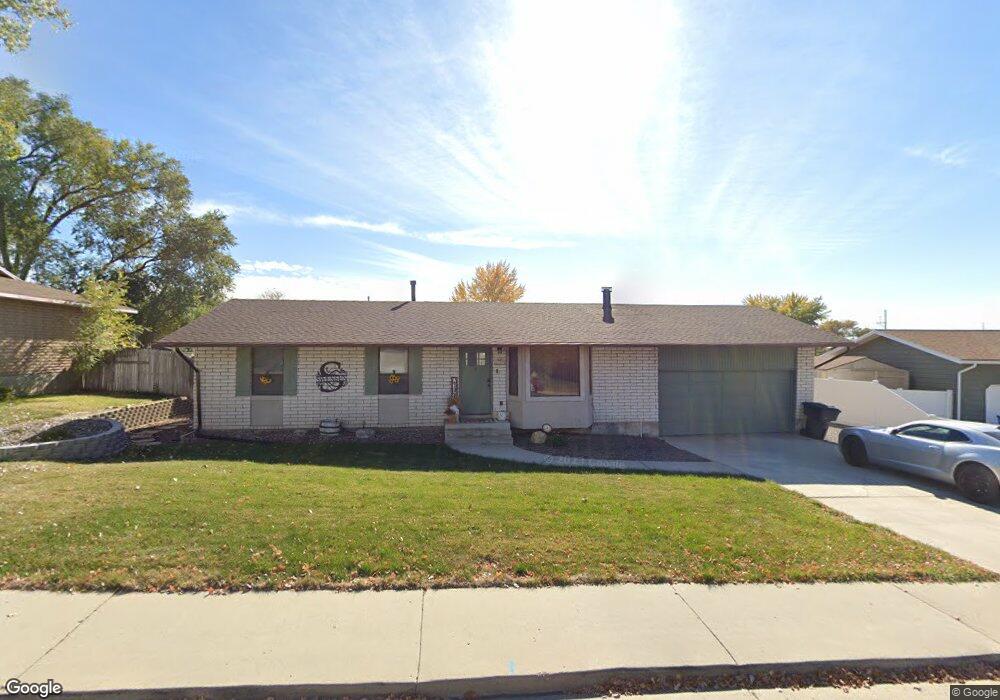
1119 W 285 S Orem, UT 84058
Orem Park NeighborhoodEstimated Value: $515,000 - $570,000
5
Beds
3
Baths
2,400
Sq Ft
$224/Sq Ft
Est. Value
About This Home
This home is located at 1119 W 285 S, Orem, UT 84058 and is currently estimated at $537,174, approximately $223 per square foot. 1119 W 285 S is a home located in Utah County with nearby schools including Orem Elementary School, Orem Junior High School, and Mountain View High School.
Ownership History
Date
Name
Owned For
Owner Type
Purchase Details
Closed on
Jan 12, 2023
Sold by
Swensen Shawn
Bought by
S & T Swensen Family Trust
Current Estimated Value
Home Financials for this Owner
Home Financials are based on the most recent Mortgage that was taken out on this home.
Original Mortgage
$50,000
Outstanding Balance
$48,376
Interest Rate
6.33%
Mortgage Type
Credit Line Revolving
Estimated Equity
$488,798
Purchase Details
Closed on
Sep 26, 2019
Sold by
Swensen Shawn David and Swensen Tamara Lynn
Bought by
Swensen Shawn and Swensen Tamara L
Home Financials for this Owner
Home Financials are based on the most recent Mortgage that was taken out on this home.
Original Mortgage
$264,900
Interest Rate
3.6%
Mortgage Type
New Conventional
Purchase Details
Closed on
Sep 18, 2017
Sold by
Swensen Shawn David and Swensen Tamara Lynn
Bought by
Swensen Shawn and Swensen Tamara L
Home Financials for this Owner
Home Financials are based on the most recent Mortgage that was taken out on this home.
Original Mortgage
$266,750
Interest Rate
3.93%
Mortgage Type
New Conventional
Purchase Details
Closed on
Sep 21, 2016
Sold by
Manning Stanley D and Manning Nancy Lou
Bought by
Manning Investments Llc
Purchase Details
Closed on
Jul 29, 2013
Sold by
Manning Stanley D and Manning Nancy Lou
Bought by
Manning Investments Llc
Purchase Details
Closed on
Mar 11, 2008
Sold by
Litster Kathleen B
Bought by
Manning Stanley D and Manning Nancy Lou
Purchase Details
Closed on
Mar 23, 2006
Sold by
Litster Kevin A and Litster Kathleen B
Bought by
Litster Kathleen B
Home Financials for this Owner
Home Financials are based on the most recent Mortgage that was taken out on this home.
Original Mortgage
$149,600
Interest Rate
9.26%
Mortgage Type
Fannie Mae Freddie Mac
Purchase Details
Closed on
Feb 24, 1997
Sold by
Gonzalez David B and Gonzalez Patricia J
Bought by
Litster Kevin A and Litster Kathleen B
Home Financials for this Owner
Home Financials are based on the most recent Mortgage that was taken out on this home.
Original Mortgage
$131,400
Interest Rate
7.15%
Create a Home Valuation Report for This Property
The Home Valuation Report is an in-depth analysis detailing your home's value as well as a comparison with similar homes in the area
Home Values in the Area
Average Home Value in this Area
Purchase History
| Date | Buyer | Sale Price | Title Company |
|---|---|---|---|
| S & T Swensen Family Trust | -- | Meridian Title | |
| Swensen Shawn | -- | Meridian Title | |
| Swensen Shawn | -- | Old Republic Title | |
| Swensen Shawn David | -- | Old Republic Title | |
| Swensen Shawn | -- | Old Republic Title | |
| Swensen Shawn David | -- | Vanguard Title Ins Agency Ll | |
| Manning Investments Llc | -- | None Available | |
| Manning Investments Llc | -- | None Available | |
| Manning Stanley D | $164,308 | None Available | |
| Litster Kathleen B | -- | Surety Title | |
| Litster Kathleen B | -- | Surety Title | |
| Litster Kevin A | -- | Old Republic Title Co Of Uta |
Source: Public Records
Mortgage History
| Date | Status | Borrower | Loan Amount |
|---|---|---|---|
| Open | Swensen Shawn | $50,000 | |
| Previous Owner | Swensen Shawn David | $264,900 | |
| Previous Owner | Swensen Shawn David | $266,750 | |
| Previous Owner | Litster Kathleen B | $149,600 | |
| Previous Owner | Litster Kevin A | $131,400 |
Source: Public Records
Tax History
| Year | Tax Paid | Tax Assessment Tax Assessment Total Assessment is a certain percentage of the fair market value that is determined by local assessors to be the total taxable value of land and additions on the property. | Land | Improvement |
|---|---|---|---|---|
| 2025 | $2,053 | $276,045 | -- | -- |
| 2024 | $2,053 | $251,020 | $0 | $0 |
| 2023 | $1,879 | $246,950 | $0 | $0 |
| 2022 | $1,908 | $242,880 | $0 | $0 |
| 2021 | $1,775 | $342,400 | $169,100 | $173,300 |
| 2020 | $1,610 | $305,200 | $135,300 | $169,900 |
| 2019 | $1,470 | $289,800 | $124,900 | $164,900 |
| 2018 | $1,385 | $260,900 | $107,600 | $153,300 |
| 2017 | $1,256 | $126,720 | $0 | $0 |
| 2016 | $1,264 | $117,590 | $0 | $0 |
| 2015 | $1,227 | $107,910 | $0 | $0 |
| 2014 | $1,198 | $104,940 | $0 | $0 |
Source: Public Records
Map
Nearby Homes
- 1148 W 285 S
- 278 S 1160 W
- 365 S 1015 W
- 350 S 1200 W Unit 2
- 237 S Ridgeview Dr
- 155 S 1200 W Unit 69
- 155 S 1200 W Unit 6
- 155 S 1200 W Unit 97
- 935 W 360 S
- 1041 W 600 S
- 896 W 30 S
- 506 S 800 West St Unit 13
- 45 N 970 W
- 520 S 800 W Unit 14
- 570 S 800 West St Unit 15
- 1431 W 650 S
- 1463 W 730 S
- 222 N 1200 W Unit 144
- 222 N 1200 W Unit 53
- 222 N 1200 W Unit 84
Your Personal Tour Guide
Ask me questions while you tour the home.