S
Seller's Agent in 2015
Sam Johnson
F.C. Tucker/Thompson
Estimated Value: $81,000 - $113,000
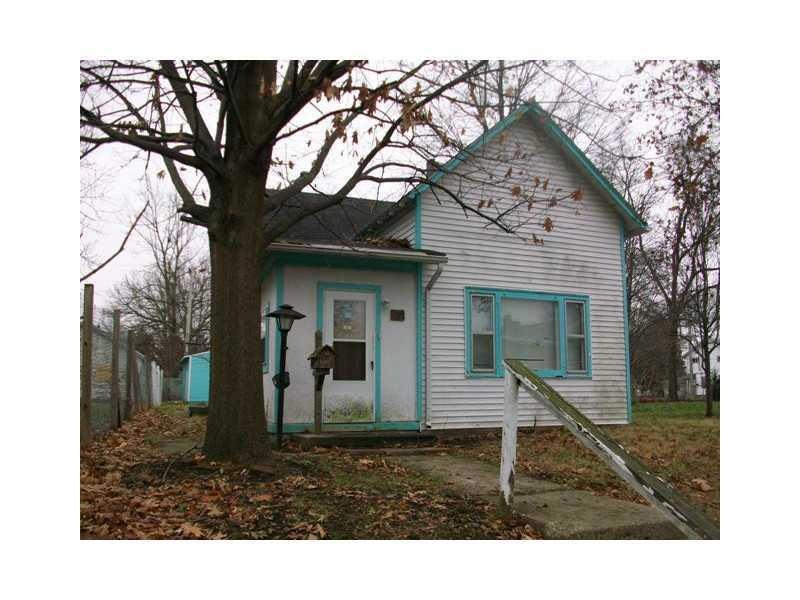
2 BEDROOMS, 1 BATH, 2 CAR GARAGE, 2 LOTS, NICE GLASS ENCLOSED PORCH OPENS TO SOUTHERN SUN, NICE SIZE KITCHEN, SOME NEWER WINDOWS, "AS IS"
Last Agent to Sell the Property
Sam Johnson
F.C. Tucker/Thompson Listed on: 01/02/2015

Last Buyer's Agent
Sam Johnson
F.C. Tucker/Thompson Listed on: 01/02/2015
| Date | Buyer | Sale Price | Title Company |
|---|---|---|---|
| Ortega Norma Arcelia | -- | Fidelity National Title |
| Date | Event | Price | List to Sale | Price per Sq Ft |
|---|---|---|---|---|
| 02/25/2015 02/25/15 | Sold | $7,000 | -29.3% | $6 / Sq Ft |
| 02/16/2015 02/16/15 | Pending | -- | -- | -- |
| 01/02/2015 01/02/15 | For Sale | $9,900 | -- | $9 / Sq Ft |
| Year | Tax Paid | Tax Assessment Tax Assessment Total Assessment is a certain percentage of the fair market value that is determined by local assessors to be the total taxable value of land and additions on the property. | Land | Improvement |
|---|---|---|---|---|
| 2024 | $544 | $51,500 | $7,600 | $43,900 |
| 2023 | $500 | $47,300 | $7,300 | $40,000 |
| 2022 | $503 | $47,400 | $7,000 | $40,400 |
| 2021 | $462 | $43,400 | $6,900 | $36,500 |
| 2020 | $440 | $41,200 | $6,600 | $34,600 |
| 2019 | $429 | $40,200 | $6,600 | $33,600 |
| 2018 | $400 | $37,000 | $6,600 | $30,400 |
| 2017 | $367 | $36,700 | $6,600 | $30,100 |
| 2016 | $367 | $36,700 | $6,600 | $30,100 |
| 2014 | $487 | $48,700 | $6,600 | $42,100 |
| 2013 | $487 | $48,700 | $6,600 | $42,100 |
S
Seller's Agent in 2015
Sam Johnson
F.C. Tucker/Thompson
Source: MIBOR Broker Listing Cooperative®
MLS Number: 21330134
APN: 48-11-11-401-166.000-003
Disclaimer: Certain information contained herein is derived from information provided by parties other than Homes.com. All information provided is deemed reliable, but is not guaranteed to be accurate and should be independently verified.
![]() Based on information submitted to the MLS GRID. All data is obtained from various sources and may not have been verified by broker or MLS GRID. Supplied Open House Information is subject to change without notice. All information should be independently reviewed and verified for accuracy. Properties may or may not be listed by the office/agent presenting the information. Some IDX listings have been excluded from this website.
Based on information submitted to the MLS GRID. All data is obtained from various sources and may not have been verified by broker or MLS GRID. Supplied Open House Information is subject to change without notice. All information should be independently reviewed and verified for accuracy. Properties may or may not be listed by the office/agent presenting the information. Some IDX listings have been excluded from this website.