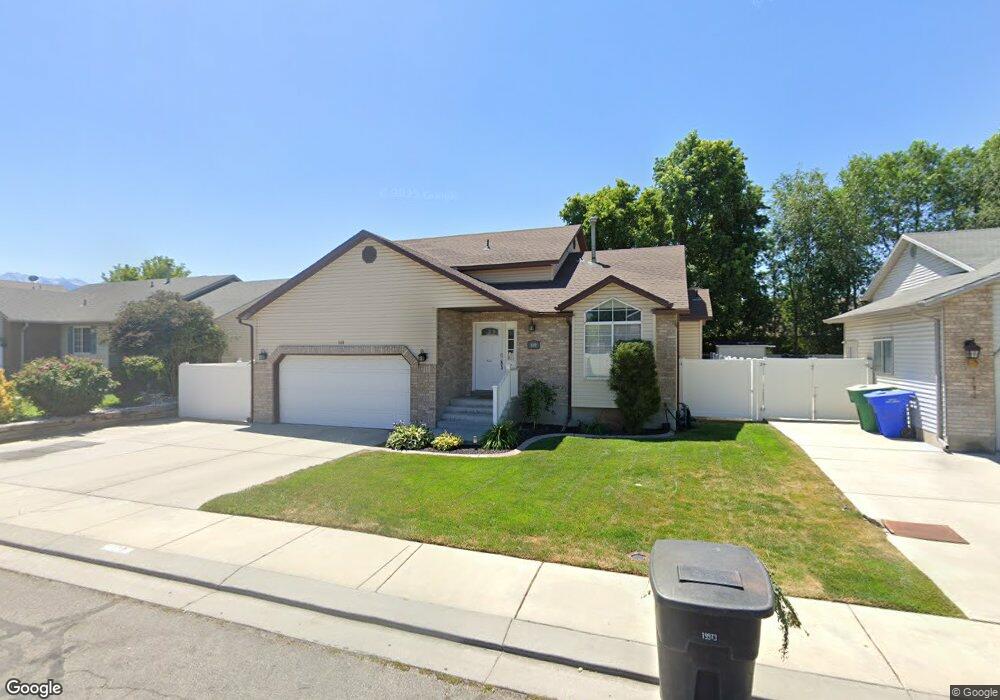
1119 Wimbledon Ridge Ln West Jordan, UT 84084
Estimated Value: $515,000 - $548,000
4
Beds
3
Baths
2,220
Sq Ft
$240/Sq Ft
Est. Value
About This Home
This home is located at 1119 Wimbledon Ridge Ln, West Jordan, UT 84084 and is currently estimated at $532,852, approximately $240 per square foot. 1119 Wimbledon Ridge Ln is a home located in Salt Lake County with nearby schools including Heartland Elementary School, West Jordan Middle School, and West Jordan High School.
Ownership History
Date
Name
Owned For
Owner Type
Purchase Details
Closed on
Mar 22, 2001
Sold by
Winward Brent J and Winward Tara A
Bought by
Mendoza Felipe and Mendoza Mirna A
Current Estimated Value
Purchase Details
Closed on
Aug 25, 1997
Sold by
Huang Paul M and Huang Susan S
Bought by
Winward Brent J and Balls Tara A
Home Financials for this Owner
Home Financials are based on the most recent Mortgage that was taken out on this home.
Original Mortgage
$135,992
Interest Rate
7.43%
Mortgage Type
FHA
Purchase Details
Closed on
Jul 13, 1994
Sold by
Garner & Reid Ltd
Bought by
Huang Paul M and Huang Susan S
Home Financials for this Owner
Home Financials are based on the most recent Mortgage that was taken out on this home.
Original Mortgage
$27,000
Interest Rate
8.57%
Create a Home Valuation Report for This Property
The Home Valuation Report is an in-depth analysis detailing your home's value as well as a comparison with similar homes in the area
Home Values in the Area
Average Home Value in this Area
Purchase History
| Date | Buyer | Sale Price | Title Company |
|---|---|---|---|
| Mendoza Felipe | -- | Superior Title | |
| Winward Brent J | -- | First American Title | |
| Huang Paul M | -- | -- |
Source: Public Records
Mortgage History
| Date | Status | Borrower | Loan Amount |
|---|---|---|---|
| Previous Owner | Winward Brent J | $135,992 | |
| Previous Owner | Huang Paul M | $27,000 |
Source: Public Records
Tax History Compared to Growth
Tax History
| Year | Tax Paid | Tax Assessment Tax Assessment Total Assessment is a certain percentage of the fair market value that is determined by local assessors to be the total taxable value of land and additions on the property. | Land | Improvement |
|---|---|---|---|---|
| 2025 | $2,430 | $485,200 | $108,900 | $376,300 |
| 2024 | $2,430 | $467,500 | $105,300 | $362,200 |
| 2023 | $2,400 | $435,100 | $95,700 | $339,400 |
| 2022 | $2,492 | $444,500 | $93,800 | $350,700 |
| 2021 | $2,083 | $338,200 | $73,500 | $264,700 |
| 2020 | $1,965 | $299,500 | $73,500 | $226,000 |
| 2019 | $1,975 | $295,100 | $73,500 | $221,600 |
| 2018 | $1,834 | $271,900 | $71,900 | $200,000 |
| 2017 | $1,723 | $254,300 | $71,900 | $182,400 |
| 2016 | $1,624 | $225,200 | $71,900 | $153,300 |
| 2015 | $1,476 | $199,500 | $75,500 | $124,000 |
| 2014 | $1,409 | $187,500 | $71,900 | $115,600 |
Source: Public Records
Map
Nearby Homes
- 1146 Athleen Dr
- 1235 W Athleen Dr
- 7340 S Seven Tree Ln Unit 76
- 7108 S 1205 W
- 1384 W 7290 S
- 6987 Overview Way
- 6937 S Hollow View Way
- 7194 S 1380 W
- 7174 S 1380 W
- 7165 Callie Dr
- 1516 W 7470 S
- 7118 S Equator Ln Unit 14 B
- 1607 W Beamon St
- 6773 S 1300 W
- 1037 Soho Dr
- 7721 S Village Bend Dr
- 7541 S Coreiano Ln
- 6486 S 1140 W Unit 182
- 6494 S 1090 W Unit 152
- 1059 W Rooftop Dr Unit 405
- 1129 Wimbledon Ridge Ln
- 1129 W Wimbledon Ridge Ln
- 1109 W Wimbledon Ridge Ln
- 1109 Wimbledon Ridge Ln
- 1122 W Rural Rd
- 1108 W Rural Rd
- 1137 Wimbledon Ridge Ln
- 1137 W Wimbledon Ridge Ln
- 1101 Wimbledon Ridge Ln
- 1101 W Wimbledon Ridge Ln
- 7262 S Wimbledon Ridge Ln
- 7262 Wimbledon Ridge Ln
- 1108 Wimbledon Ridge Ln
- 1118 Wimbledon Ridge Ln
- 1118 W Wimbledon Ridge Ln
- 1122 Rural Rd
- 1108 Rural Rd
- 1108 Rural Rd Unit lot 3
- 1128 W Wimbledon Ridge Ln
- 1128 Wimbledon Ridge Ln