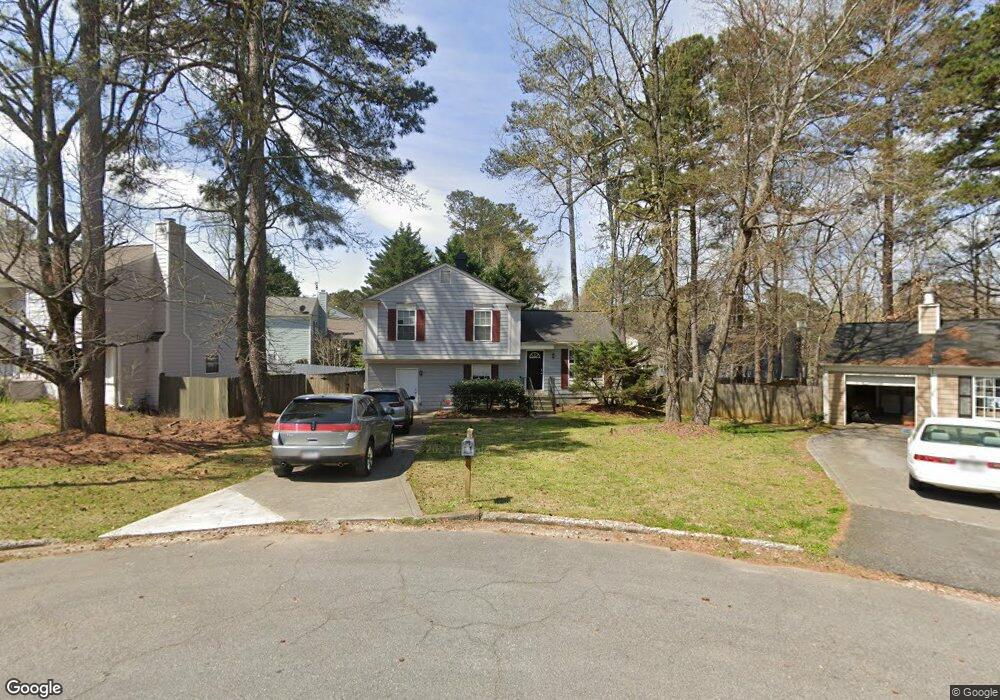
11190 Crowthore Ct Alpharetta, GA 30022
Estimated Value: $363,000 - $446,000
4
Beds
2
Baths
1,056
Sq Ft
$382/Sq Ft
Est. Value
About This Home
This home is located at 11190 Crowthore Ct, Alpharetta, GA 30022 and is currently estimated at $403,348, approximately $381 per square foot. 11190 Crowthore Ct is a home located in Fulton County with nearby schools including Ocee Elementary School, Taylor Road Middle School, and Chattahoochee High School.
Ownership History
Date
Name
Owned For
Owner Type
Purchase Details
Closed on
Jun 30, 2014
Sold by
Colfin Ai Ga 1
Bought by
Cah 2014 2 Borrower Llc
Current Estimated Value
Home Financials for this Owner
Home Financials are based on the most recent Mortgage that was taken out on this home.
Original Mortgage
$558,499,968
Outstanding Balance
$425,569,673
Interest Rate
4.17%
Mortgage Type
New Conventional
Estimated Equity
-$425,166,325
Purchase Details
Closed on
Apr 15, 2013
Sold by
Bank Of America Na
Bought by
Colfin Ai Ga 1 Llc
Purchase Details
Closed on
Jan 31, 2007
Sold by
Heimlich John F and Heimlich Carolynn F
Bought by
Martin Christopher and Martin Belinda
Home Financials for this Owner
Home Financials are based on the most recent Mortgage that was taken out on this home.
Original Mortgage
$125,520
Interest Rate
6.14%
Mortgage Type
New Conventional
Create a Home Valuation Report for This Property
The Home Valuation Report is an in-depth analysis detailing your home's value as well as a comparison with similar homes in the area
Home Values in the Area
Average Home Value in this Area
Purchase History
| Date | Buyer | Sale Price | Title Company |
|---|---|---|---|
| Cah 2014 2 Borrower Llc | -- | -- | |
| Colfin Ai Ga 1 Llc | $125,000 | -- | |
| Martin Christopher | $156,900 | -- |
Source: Public Records
Mortgage History
| Date | Status | Borrower | Loan Amount |
|---|---|---|---|
| Open | Cah 2014 2 Borrower Llc | $558,499,968 | |
| Previous Owner | Martin Christopher | $125,520 |
Source: Public Records
Tax History Compared to Growth
Tax History
| Year | Tax Paid | Tax Assessment Tax Assessment Total Assessment is a certain percentage of the fair market value that is determined by local assessors to be the total taxable value of land and additions on the property. | Land | Improvement |
|---|---|---|---|---|
| 2025 | $4,165 | $138,760 | $37,200 | $101,560 |
| 2023 | $3,071 | $108,800 | $28,440 | $80,360 |
| 2022 | $3,339 | $108,800 | $28,440 | $80,360 |
| 2021 | $2,335 | $74,120 | $15,680 | $58,440 |
| 2020 | $2,386 | $74,120 | $15,680 | $58,440 |
| 2019 | $248 | $74,120 | $15,680 | $58,440 |
| 2018 | $2,358 | $72,400 | $15,320 | $57,080 |
| 2017 | $1,974 | $58,000 | $14,480 | $43,520 |
| 2016 | $1,945 | $58,000 | $14,480 | $43,520 |
| 2015 | $2,047 | $60,360 | $14,480 | $45,880 |
| 2014 | $1,763 | $50,000 | $13,200 | $36,800 |
Source: Public Records
Map
Nearby Homes
- 4740 Carversham Way
- 4790 Roswell Mill Dr
- 11390 Ridge Hill Dr
- 4965 N Bridges Dr
- 130 Douglas Fir Ct Unit 1
- 11085 State Bridge Rd
- 310 Creekside Dr
- 4965 Cinnabar Dr
- 134 Wards Crossing Way Unit 17
- 4815 Tanners Spring Dr
- 5022 Anclote Dr
- 4645 Valais Ct Unit 109
- 5060 Cinnabar Dr
- 10906 Gallier St
- 4905 Weathervane Dr
- 225 Morton Creek Cir
- 11125 Pinehigh Dr
- 690 Kimball Parc Way
- 680 Kimball Parc Way
- 485 Portrait Cir
- 11190 Crowthorne Ct
- 11200 Crowthore Ct
- 4750 Carversham Way
- 11325 Bramshill Dr
- 0 Crowthore Ct Unit 7191382
- 0 Crowthore Ct Unit 8416768
- 11360 Bramshill Dr
- 4730 Carversham Way
- 0 Carversham Way Unit 9019187
- 11210 Crowthore Ct
- 11315 Bramshill Dr
- 4720 Carversham Way
- 4720 Carversham Way Unit 85
- 4745 Carversham Way
- 11195 Crowthore Ct
- 11350 Bramshill Dr
- 4770 Carversham Way
- 11205 Crowthore Ct
- 11305 Bramshill Dr
- 4745 Jones Bridge Woods Dr