Estimated Value: $383,000 - $790,327
3
Beds
2
Baths
2,530
Sq Ft
$232/Sq Ft
Est. Value
About This Home
This home is located at 11193 N 1620 W, Neola, UT 84053 and is currently estimated at $586,664, approximately $231 per square foot. 11193 N 1620 W is a home located in Duchesne County with nearby schools including Neola School, Roosevelt Junior High School, and Union High School.
Ownership History
Date
Name
Owned For
Owner Type
Purchase Details
Closed on
Jan 14, 2022
Sold by
Smith Shalynn R and Smith Timothy G
Bought by
Goff Randall B
Current Estimated Value
Purchase Details
Closed on
Aug 31, 2020
Sold by
Awnd Properties Llc
Bought by
Smith Timothy G and Lochnikar-Smith Shannon L
Create a Home Valuation Report for This Property
The Home Valuation Report is an in-depth analysis detailing your home's value as well as a comparison with similar homes in the area
Home Values in the Area
Average Home Value in this Area
Purchase History
| Date | Buyer | Sale Price | Title Company |
|---|---|---|---|
| Goff Randall B | -- | Express Title Ins Agcy Inc | |
| Smith Timothy G | -- | Express Title Ins Agcy Inc |
Source: Public Records
Tax History Compared to Growth
Tax History
| Year | Tax Paid | Tax Assessment Tax Assessment Total Assessment is a certain percentage of the fair market value that is determined by local assessors to be the total taxable value of land and additions on the property. | Land | Improvement |
|---|---|---|---|---|
| 2025 | $4,275 | $673,481 | $98,349 | $575,132 |
| 2024 | $4,239 | $673,481 | $98,349 | $575,132 |
| 2023 | $4,239 | $673,481 | $98,349 | $575,132 |
| 2022 | $4,106 | $582,269 | $97,754 | $484,515 |
| 2021 | $2,926 | $418,605 | $97,754 | $320,851 |
| 2020 | $4,353 | $384,100 | $97,512 | $286,588 |
| 2019 | $4,326 | $384,100 | $97,512 | $286,588 |
| 2018 | $2,480 | $365,775 | $93,794 | $271,981 |
| 2017 | $2,368 | $0 | $0 | $0 |
| 2016 | $2,348 | $0 | $0 | $0 |
| 2015 | $2,168 | $0 | $0 | $0 |
| 2014 | $2,125 | $365,775 | $93,794 | $271,981 |
| 2013 | $2,341 | $394,070 | $78,300 | $315,770 |
Source: Public Records
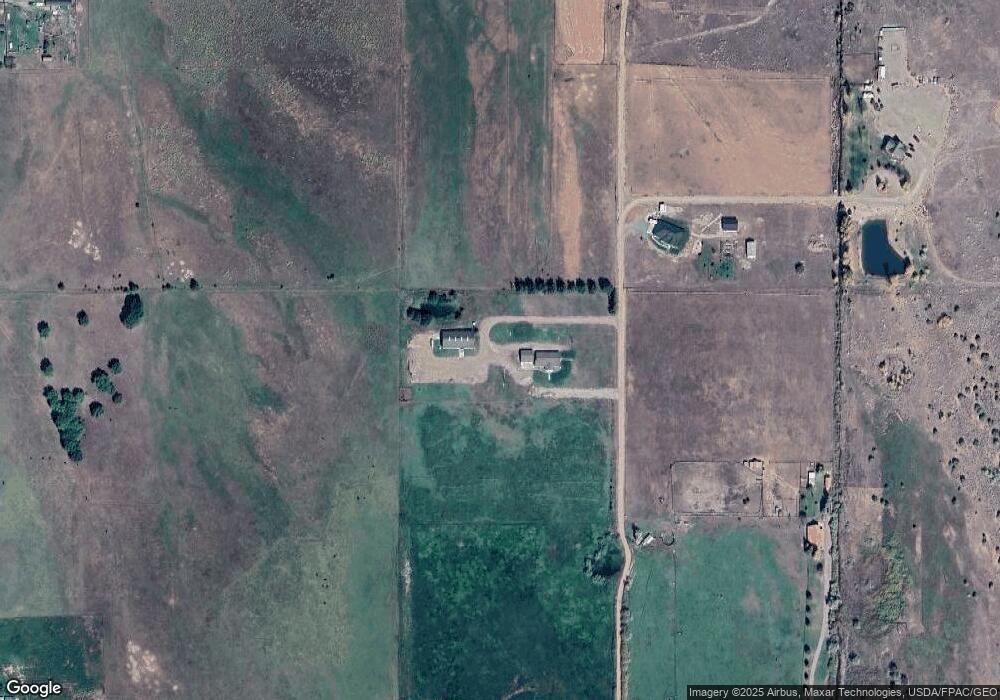
Map
Nearby Homes
- 9181 N 9183 N 2160 W
- 979 N 3650 W Unit B
- 9765 N Uintah Canyon Hwy
- 3895 W 9000 N Unit 1,2,3,
- 3460 W 9000 N Unit 4
- 9151 N 2160 W
- 2192 W 9000 N
- 7374 N 3250 W
- 2560 W 2000 S Unit 6
- 2640 W 2000 S Unit 4
- 2600 W 2000 S Unit 5
- 874 N 3500 E
- 1 W 5600 N
- 3249 E 7000 N
- 8750 6000 W
- 8750 W 6000 N
- 5900 W 6000 N
- 5104 W 5550 N
- 6940 W 5875 N
- 5293 N 6150 W
- 6250 W 6600 N
- 0 See Remarks Unit 496334
- 1978 W 2000 N
- 0 See Remarks Unit 499241
- 0 See Remarks Unit 45 723136
- 0 See Remarks Unit 648629
- 0 See Remarks Unit 728275
- 0 See Remarks Unit 717735
- 0 See Remarks Unit 667306
- 0 See Remarks Unit 517063
- 0 See Remarks Unit 517062
- 0 See Remarks Unit 598634
- 0 See Remarks Unit 510436
- 0 See Remarks Unit 497448
- 0 See Remarks Unit 669087
- 0 See Remarks Unit 587980
- 0 See Remarks Unit 746680
- 0 See Remarks Unit 517860
- 0 See Remarks Unit 494170
- 9227 Uintah Canyon Hwy