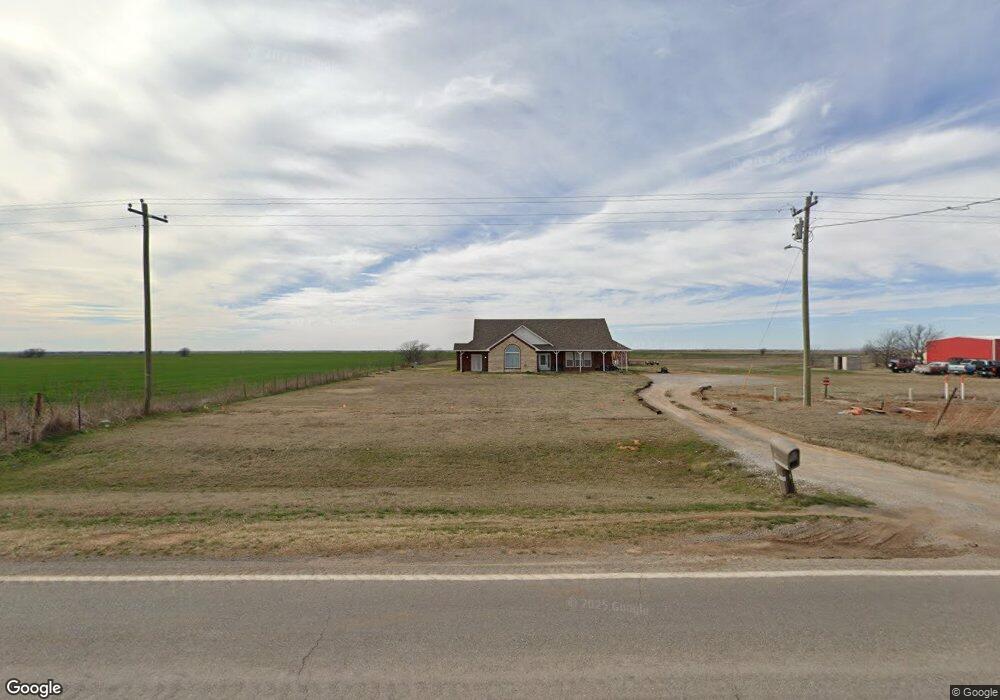
11193 SW 11th St Geronimo, OK 73543
Estimated Value: $288,640 - $304,000
4
Beds
2
Baths
2,600
Sq Ft
$114/Sq Ft
Est. Value
About This Home
This home is located at 11193 SW 11th St, Geronimo, OK 73543 and is currently estimated at $295,910, approximately $113 per square foot. 11193 SW 11th St is a home located in Comanche County with nearby schools including Geronimo Elementary School and Geronimo High School.
Ownership History
Date
Name
Owned For
Owner Type
Purchase Details
Closed on
Mar 29, 2012
Sold by
Federal Home Loan Mortgage Corporation
Bought by
Tucker Michael P and Tucker Emily
Current Estimated Value
Home Financials for this Owner
Home Financials are based on the most recent Mortgage that was taken out on this home.
Original Mortgage
$151,230
Outstanding Balance
$104,132
Interest Rate
3.92%
Mortgage Type
New Conventional
Estimated Equity
$191,778
Create a Home Valuation Report for This Property
The Home Valuation Report is an in-depth analysis detailing your home's value as well as a comparison with similar homes in the area
Home Values in the Area
Average Home Value in this Area
Purchase History
| Date | Buyer | Sale Price | Title Company |
|---|---|---|---|
| Tucker Michael P | $145,000 | The Oklahoma City Abstract & |
Source: Public Records
Mortgage History
| Date | Status | Borrower | Loan Amount |
|---|---|---|---|
| Open | Tucker Michael P | $151,230 |
Source: Public Records
Tax History Compared to Growth
Tax History
| Year | Tax Paid | Tax Assessment Tax Assessment Total Assessment is a certain percentage of the fair market value that is determined by local assessors to be the total taxable value of land and additions on the property. | Land | Improvement |
|---|---|---|---|---|
| 2025 | $2,273 | $22,160 | $30 | $22,130 |
| 2024 | $2,273 | $23,721 | $2,112 | $21,609 |
| 2023 | $2,273 | $22,687 | $1,844 | $20,843 |
| 2022 | $2,133 | $22,026 | $1,673 | $20,353 |
| 2021 | $2,067 | $21,385 | $1,507 | $19,878 |
| 2020 | $2,080 | $20,761 | $1,345 | $19,416 |
| 2019 | $2,113 | $20,158 | $1,211 | $18,947 |
| 2018 | $1,958 | $19,197 | $932 | $18,265 |
| 2017 | $1,937 | $18,283 | $694 | $17,589 |
| 2016 | $1,745 | $17,412 | $506 | $16,906 |
| 2015 | $1,734 | $17,245 | $506 | $16,739 |
| 2014 | $1,631 | $16,424 | $506 | $15,918 |
Source: Public Records
Map
Nearby Homes
- TBD Cheyenne Ln
- 4 Cheyenne Ln
- 404 404 Bobwhite
- 502 Scissortail St
- 309 E Seminole St
- 217 Cherokee St
- 301 E Main St
- 624 E Main St
- 403 Nebraska Ave
- 412 SW Landmark Cir
- 11158 SE 45th St
- 0 SE Flower Mound Rd
- TBD SW 38th St
- 2502-04 SW 38th St Unit 3625-27 SW Wedgwood
- 722 SW Butterfield Dr
- N2600
- 3303 SW Salinas Dr
- 716 SW Arbuckle Ave
- 708 SW Arbuckle Ave
- 1416 SW Wisconsin Ave
- 11404 SW 11th St
- 11724 SW 11th St
- 1208 SW Burk Rd
- 706 SW Burk Rd
- 706 SW Burk Rd
- 1011 SW Baseline Rd
- 12401 SW 11th St
- 10202 SW 11th St
- 333 SW Burk Rd
- 140 Arapaho St
- 144 Arapaho St
- 144 Arapaho St
- 138 Arapaho St
- 134 Mohawk Cir
- 136 Arapaho St
- 134 Arapaho St
- 130 Mohawk Cir
- 132 Arapaho St
- 130 Arapaho St
- 117 Arapaho St