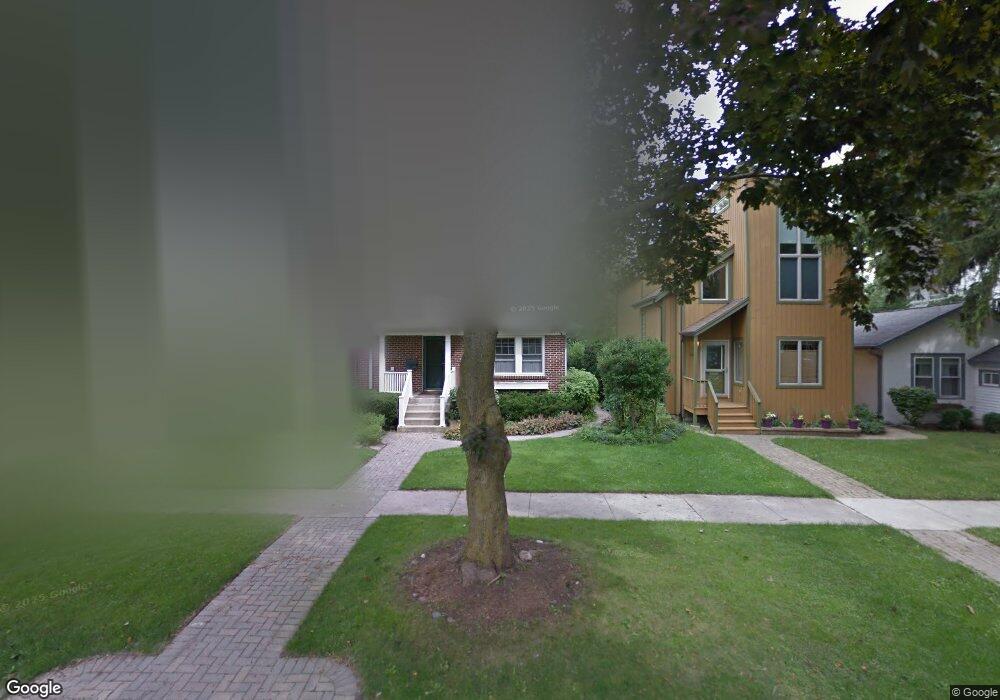
112 16th St Wilmette, IL 60091
Estimated Value: $812,162 - $1,054,000
5
Beds
5
Baths
1,487
Sq Ft
$600/Sq Ft
Est. Value
About This Home
This home is located at 112 16th St, Wilmette, IL 60091 and is currently estimated at $892,291, approximately $600 per square foot. 112 16th St is a home located in Cook County with nearby schools including McKenzie Elementary School, Highcrest Middle School, and Wilmette Junior High School.
Ownership History
Date
Name
Owned For
Owner Type
Purchase Details
Closed on
Mar 25, 2022
Sold by
Hipschen Christopher M and Hipschen Elizabeth A
Bought by
Christopher Michael Hipschen Trust and Elizabeth Ann Sullivan Trust
Current Estimated Value
Purchase Details
Closed on
Jul 5, 2006
Sold by
Challinor Mark A and Challinor Elizabeth A
Bought by
Hipschen Christopher M and Sullivan Elizabeth A
Home Financials for this Owner
Home Financials are based on the most recent Mortgage that was taken out on this home.
Original Mortgage
$100,000
Interest Rate
6.73%
Mortgage Type
Purchase Money Mortgage
Purchase Details
Closed on
Sep 30, 1996
Sold by
Eifler John and Eifler Karen
Bought by
Challinor Mark A and Challinor Elizabeth A
Home Financials for this Owner
Home Financials are based on the most recent Mortgage that was taken out on this home.
Original Mortgage
$240,500
Interest Rate
8.14%
Mortgage Type
Balloon
Create a Home Valuation Report for This Property
The Home Valuation Report is an in-depth analysis detailing your home's value as well as a comparison with similar homes in the area
Home Values in the Area
Average Home Value in this Area
Purchase History
| Date | Buyer | Sale Price | Title Company |
|---|---|---|---|
| Christopher Michael Hipschen Trust | -- | None Listed On Document | |
| Hipschen Christopher Michael | -- | -- | |
| Hipschen Christopher M | $605,000 | Multiple | |
| Challinor Mark A | $275,000 | -- |
Source: Public Records
Mortgage History
| Date | Status | Borrower | Loan Amount |
|---|---|---|---|
| Previous Owner | Hipschen Christopher M | $100,000 | |
| Previous Owner | Challinor Mark A | $240,500 |
Source: Public Records
Tax History Compared to Growth
Tax History
| Year | Tax Paid | Tax Assessment Tax Assessment Total Assessment is a certain percentage of the fair market value that is determined by local assessors to be the total taxable value of land and additions on the property. | Land | Improvement |
|---|---|---|---|---|
| 2024 | $9,686 | $46,000 | $13,750 | $32,250 |
| 2023 | $9,145 | $46,000 | $13,750 | $32,250 |
| 2022 | $9,145 | $46,000 | $13,750 | $32,250 |
| 2021 | $10,317 | $43,041 | $10,000 | $33,041 |
| 2020 | $10,206 | $43,041 | $10,000 | $33,041 |
| 2019 | $9,890 | $46,784 | $10,000 | $36,784 |
| 2018 | $8,871 | $40,723 | $8,500 | $32,223 |
| 2017 | $8,640 | $40,723 | $8,500 | $32,223 |
| 2016 | $9,276 | $45,171 | $8,500 | $36,671 |
| 2015 | $8,963 | $38,728 | $7,000 | $31,728 |
| 2014 | $8,834 | $38,728 | $7,000 | $31,728 |
| 2013 | $8,422 | $38,728 | $7,000 | $31,728 |
Source: Public Records
Map
Nearby Homes
- 115 16th St
- 1517 Gregory Ave
- 1531 Wilmette Ave
- 2716 Ewing Ave
- 2663 Lawndale Ave
- 1241 Maple Ave
- 410 Prairie Ave
- 2508 Isabella St
- 1209 Maple Ave
- 1918 Wilmette Ave Unit B
- 2726 Central St Unit 3D
- 2720 Central St Unit 4C
- 1142 Oakwood Ave
- 3233 Central St
- 2047 Wilmette Ave
- 2333 Central St Unit 502
- 2951 Colfax St
- 621 Green Bay Rd
- 1936 Birchwood Ave
- 2424 Cowper Ave