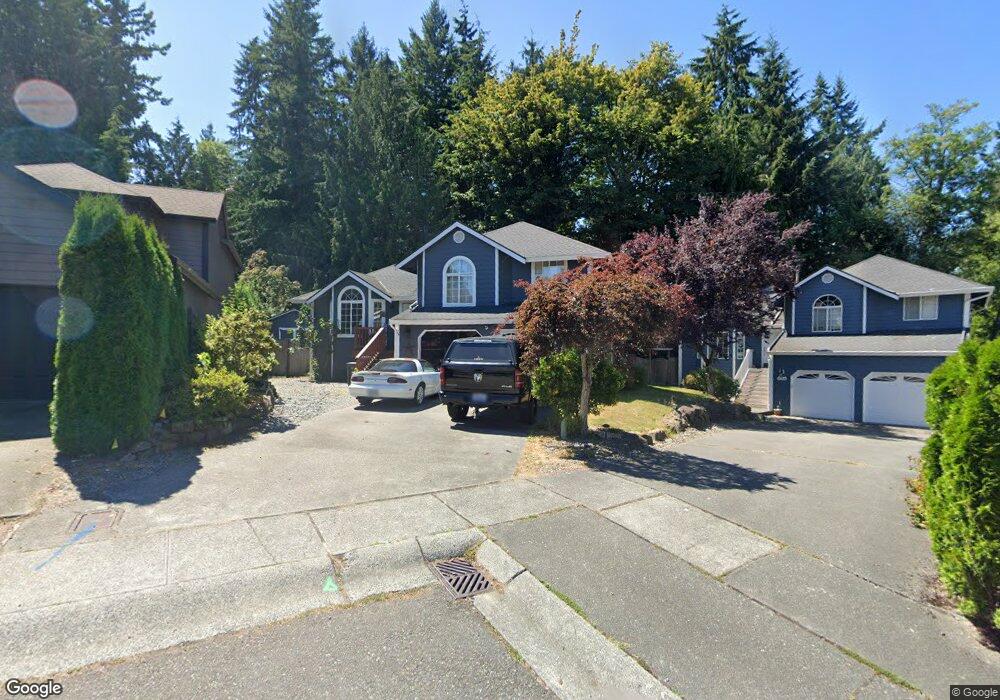
112 87th Ave SE Lake Stevens, WA 98258
West Lake Stevens NeighborhoodEstimated Value: $614,000 - $647,000
3
Beds
3
Baths
1,634
Sq Ft
$387/Sq Ft
Est. Value
About This Home
This home is located at 112 87th Ave SE, Lake Stevens, WA 98258 and is currently estimated at $632,618, approximately $387 per square foot. 112 87th Ave SE is a home located in Snohomish County with nearby schools including Hillcrest Elementary School, Lake Stevens Middle School, and Cavelero Mid High School.
Ownership History
Date
Name
Owned For
Owner Type
Purchase Details
Closed on
Aug 9, 2023
Sold by
Jerra K Crain And Mary J Crain Revocable
Bought by
Crain Corey
Current Estimated Value
Purchase Details
Closed on
Sep 20, 2017
Sold by
Crain Jerra and Crain Mary
Bought by
Crain Jerry K and Crain Mary J
Purchase Details
Closed on
Nov 7, 2016
Sold by
Crain Mary and Crain Jerra
Bought by
Crain Jerra
Home Financials for this Owner
Home Financials are based on the most recent Mortgage that was taken out on this home.
Original Mortgage
$255,000
Interest Rate
3.42%
Mortgage Type
Seller Take Back
Create a Home Valuation Report for This Property
The Home Valuation Report is an in-depth analysis detailing your home's value as well as a comparison with similar homes in the area
Home Values in the Area
Average Home Value in this Area
Purchase History
| Date | Buyer | Sale Price | Title Company |
|---|---|---|---|
| Crain Corey | $313 | None Listed On Document | |
| Crain Jerry K | -- | None Available | |
| Crain Jerry | -- | None Available | |
| Crain Jerra | -- | Old Republic Title Ltd | |
| Crain Jerra | $300,000 | Old Republic Title Ltd |
Source: Public Records
Mortgage History
| Date | Status | Borrower | Loan Amount |
|---|---|---|---|
| Previous Owner | Crain Jerra | $255,000 |
Source: Public Records
Tax History Compared to Growth
Tax History
| Year | Tax Paid | Tax Assessment Tax Assessment Total Assessment is a certain percentage of the fair market value that is determined by local assessors to be the total taxable value of land and additions on the property. | Land | Improvement |
|---|---|---|---|---|
| 2025 | $5,307 | $613,300 | $318,000 | $295,300 |
| 2024 | $5,307 | $568,200 | $286,000 | $282,200 |
| 2023 | $5,055 | $585,800 | $297,000 | $288,800 |
| 2022 | $4,608 | $440,000 | $205,000 | $235,000 |
| 2020 | $4,281 | $381,600 | $180,000 | $201,600 |
| 2019 | $3,985 | $350,600 | $161,000 | $189,600 |
| 2018 | $3,879 | $314,800 | $137,000 | $177,800 |
| 2017 | $3,082 | $281,500 | $116,000 | $165,500 |
| 2016 | $3,092 | $262,800 | $104,000 | $158,800 |
| 2015 | $3,054 | $241,000 | $92,000 | $149,000 |
| 2013 | $2,825 | $195,200 | $72,000 | $123,200 |
Source: Public Records
Map
Nearby Homes
- 8229 1st St SE
- 228 86th Ave SE
- 8707 1st Place NE Unit B
- 8905 Meridian Place NE Unit 201
- 129 82nd Dr SE
- 9126 1st Place NE Unit 3
- 405 82nd Ave SE
- 9210 Market Place Unit E102
- 9210 Market Place Unit G104
- 9210 Market Place Unit P201
- 9210 Market Place Unit F202
- 8408 6th Place SE
- 607 91st Ave SE
- 9003 8th St SE
- 9005 8th St SE
- 9130 7th St SE
- 8420 8th Place SE
- 7905 5th Place SE
- 21 95th Dr SE
- 8312 8th Place SE
- 106 87th Ave SE
- 113 87th Ave SE
- 109 87th Ave SE
- 103 87th Ave SE
- 8920 B 1st St NE Unit E-2
- 8920 A 1st St NE Unit E1
- 8914 A 1st St NE Unit F-1
- 8914 B 1st St NE Unit F-2
- 32 86th Dr SE
- 8713 1st St SE
- 8708 1st St SE
- 8424 1st St SE
- 30 86th Dr SE
- 8418 1st St SE
- 8418 1st St SE
- 24 86th Dr SE
- 8727 1st St SE
- 8714 1st St SE
- 18 86th Dr SE