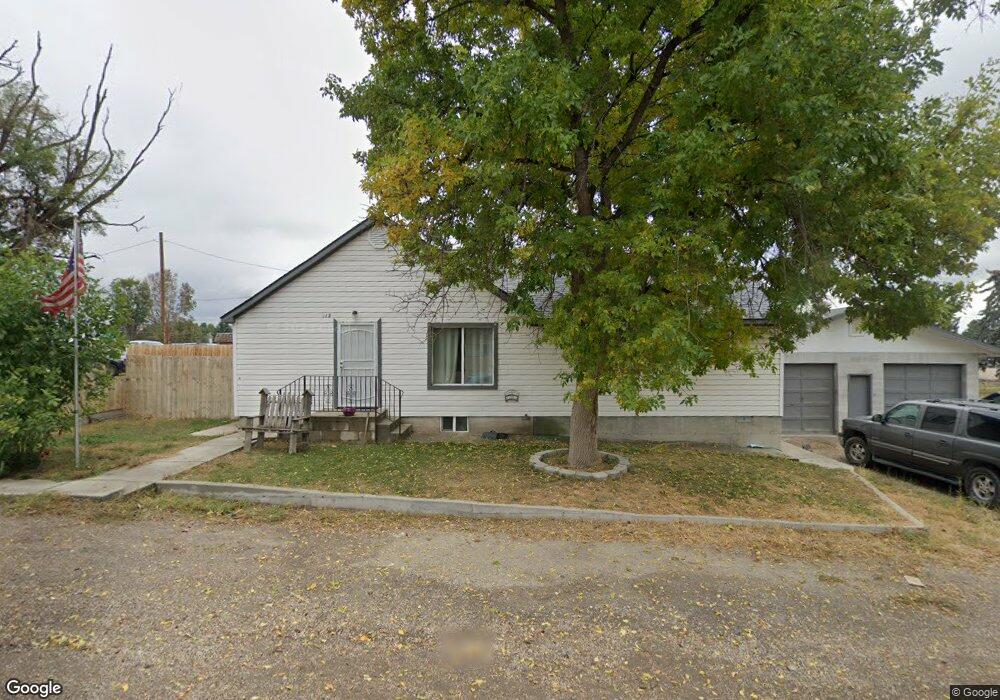
112 9th Ave W Marsing, ID 83639
Estimated Value: $242,000 - $338,000
2
Beds
1
Bath
1,732
Sq Ft
$169/Sq Ft
Est. Value
About This Home
This home is located at 112 9th Ave W, Marsing, ID 83639 and is currently estimated at $293,082, approximately $169 per square foot. 112 9th Ave W is a home located in Owyhee County with nearby schools including Marsing Elementary School, Marsing Middle School, and Marsing High School.
Ownership History
Date
Name
Owned For
Owner Type
Purchase Details
Closed on
May 14, 2024
Sold by
Clausen Don and Clausen Dawn
Bought by
Lr Main Street Llc
Current Estimated Value
Purchase Details
Closed on
Oct 1, 2018
Sold by
Cuningham Judith May
Bought by
Clausen Don
Home Financials for this Owner
Home Financials are based on the most recent Mortgage that was taken out on this home.
Original Mortgage
$127,645
Interest Rate
4.5%
Mortgage Type
FHA
Purchase Details
Closed on
Jul 16, 2010
Sold by
Secretary Of Hud
Bought by
Cuningham Judith May
Home Financials for this Owner
Home Financials are based on the most recent Mortgage that was taken out on this home.
Original Mortgage
$62,689
Interest Rate
4.25%
Mortgage Type
FHA
Purchase Details
Closed on
Jul 14, 2005
Sold by
Urriola Louis
Bought by
Burson Keith E
Home Financials for this Owner
Home Financials are based on the most recent Mortgage that was taken out on this home.
Original Mortgage
$106,438
Interest Rate
5.55%
Mortgage Type
FHA
Create a Home Valuation Report for This Property
The Home Valuation Report is an in-depth analysis detailing your home's value as well as a comparison with similar homes in the area
Home Values in the Area
Average Home Value in this Area
Purchase History
| Date | Buyer | Sale Price | Title Company |
|---|---|---|---|
| Lr Main Street Llc | -- | Pioneer Title | |
| Clausen Don | -- | Titleone Boise | |
| Cuningham Judith May | -- | -- | |
| Burson Keith E | -- | -- |
Source: Public Records
Mortgage History
| Date | Status | Borrower | Loan Amount |
|---|---|---|---|
| Previous Owner | Clausen Don | $127,645 | |
| Previous Owner | Cuningham Judith May | $62,689 | |
| Previous Owner | Burson Keith E | $106,438 |
Source: Public Records
Tax History Compared to Growth
Tax History
| Year | Tax Paid | Tax Assessment Tax Assessment Total Assessment is a certain percentage of the fair market value that is determined by local assessors to be the total taxable value of land and additions on the property. | Land | Improvement |
|---|---|---|---|---|
| 2024 | $1,864 | $212,261 | $69,731 | $142,530 |
| 2023 | $1,851 | $192,588 | $64,798 | $127,790 |
| 2022 | $898 | $192,588 | $64,798 | $127,790 |
| 2021 | $1,083 | $183,170 | $97,770 | $85,400 |
| 2020 | $882 | $136,010 | $76,200 | $59,810 |
| 2019 | $970 | $127,840 | $76,200 | $51,640 |
| 2018 | $952 | $118,300 | $63,590 | $54,710 |
| 2017 | $511 | $114,010 | $63,590 | $50,420 |
| 2016 | $185 | $87,224 | $52,144 | $35,080 |
| 2014 | $405 | $71,714 | $42,141 | $29,573 |
| 2011 | -- | $42,996 | $23,610 | $19,386 |
Source: Public Records
Map
Nearby Homes
- 928 W Main St
- Poison Creek Rd
- TBD Canal St
- 224 Motzko St
- 405 Live Oak Ave
- 7253 Riverview Dr
- 540 Morning Dove Way
- 311 Riverview Dr
- 309 River View Dr
- TBD N Bruneau Rd
- 20056 Sunny Slope Rd
- 6708 Sunset Ln
- 20477 Lowell Rd
- 13366 Chicken Dinner Rd
- 20264 John Ln
- 8142 Us Highway 95
- 18227 Southlake Cir
- 10430 Randall Ln
- TBD Oak River Ln
- 11326 W Rio Rd