112 Alford St Lagrange, GA 30240
Estimated Value: $147,000 - $156,182
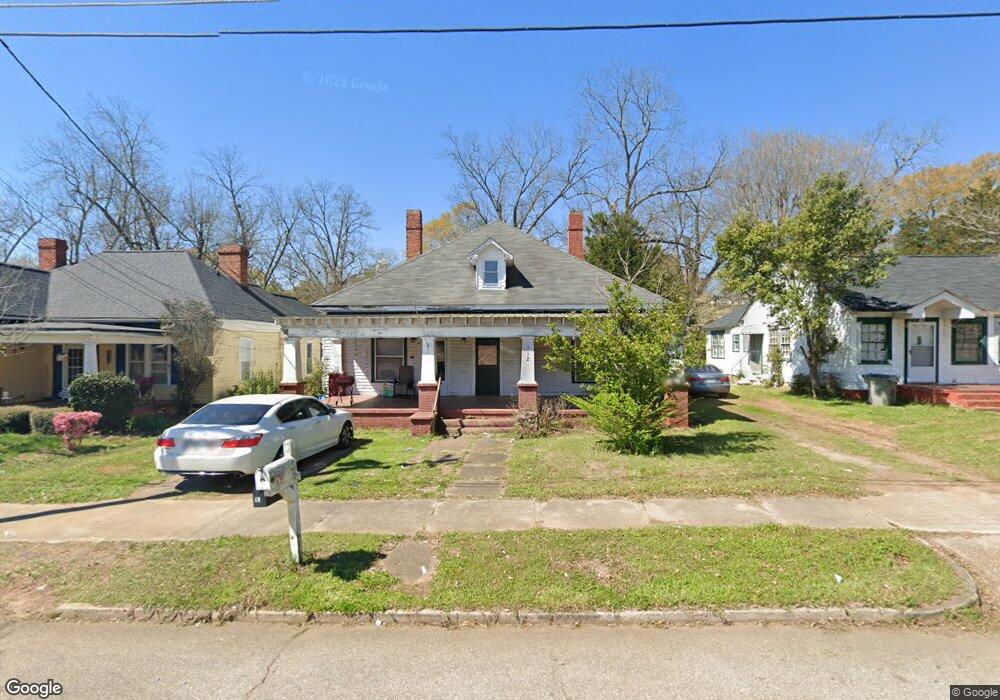
About This Home
This home is located at 112 Alford St, Lagrange, GA 30240 and is currently estimated at $151,546, approximately $68 per square foot. 112 Alford St is a home located in Troup County with nearby schools including Hollis Hand Elementary School, Ethel W. Kight Elementary School, and Franklin Forest Elementary School.
Ownership History
We collect this data history from publicly available records. To have your information removed, we recommend requesting removal directly through your county’s website.
Purchase Details
Home Financials for this Owner
Home Financials are based on the most recent Mortgage that was taken out on this home.Purchase Details
Purchase Details
Purchase Details
Purchase Details
Purchase History
We collect this data history from publicly available records. To have your information removed, we recommend requesting removal directly through your county’s website.
| Date | Buyer | Sale Price | Title Company |
|---|---|---|---|
| $72,000 | -- | ||
| $42,000 | -- | ||
| -- | -- | ||
| $19,000 | -- | ||
| -- | -- |
Mortgage History
We collect this data history from publicly available records. To have your information removed, we recommend requesting removal directly through your county’s website.
| Date | Status | Borrower | Loan Amount |
|---|---|---|---|
| Open | $64,800 |
Tax History
We collect this data history from publicly available records. To have your information removed, we recommend requesting removal directly through your county’s website.
| Year | Tax Paid | Tax Assessment Tax Assessment Total Assessment is a certain percentage of the fair market value that is determined by local assessors to be the total taxable value of land and additions on the property. | Land | Improvement |
|---|---|---|---|---|
| 2025 | $1,263 | $46,320 | $3,240 | $43,080 |
| 2024 | $1,175 | $43,100 | $3,240 | $39,860 |
| 2023 | $1,051 | $38,540 | $3,240 | $35,300 |
| 2022 | $866 | $36,500 | $3,240 | $33,260 |
| 2021 | $801 | $26,572 | $3,240 | $23,332 |
| 2020 | $801 | $26,572 | $3,240 | $23,332 |
| 2019 | $740 | $24,532 | $3,240 | $21,292 |
| 2018 | $733 | $24,292 | $3,000 | $21,292 |
| 2017 | $733 | $24,292 | $3,000 | $21,292 |
| 2016 | $702 | $23,266 | $3,000 | $20,266 |
| 2015 | $711 | $23,526 | $3,259 | $20,266 |
| 2014 | $680 | $22,459 | $3,259 | $19,200 |
| 2013 | -- | $23,902 | $3,259 | $20,642 |
Map
- 405 W Broome St Unit 2
- 405 W Broome St Unit 3
- 405 W Broome St Unit 4
- 405 W Broome St Unit 1
- 405 W Broome St Unit 5
- 208 Boulevard
- TRACT 1 W Haralson St
- 206 Broad St
- 304 Boulevard
- 408 Harwell Ave
- 207 Wilkes St
- 603 Piney Woods Dr
- 704 S Greenwood St
- 450 Gordon Cir
- 600 Park Ave
- 217 Jefferson St
- 601 Cherokee Rd
- 609 Ridley Ave
- 707 Ridley Ave
- 611 Ridley Ave
Ask me questions while you tour the home.