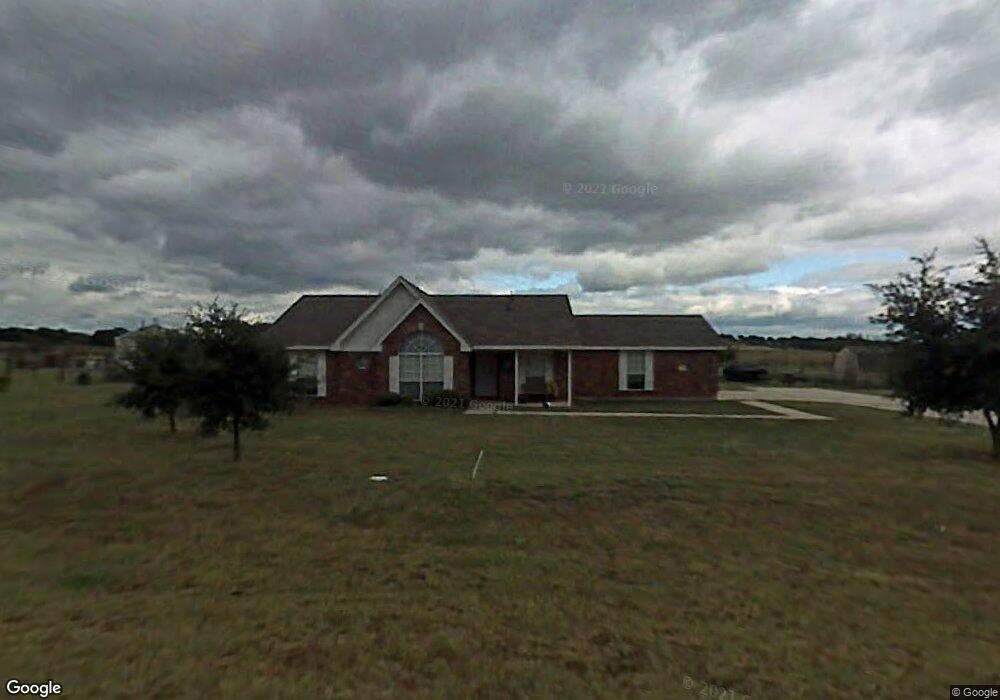
112 Applebee Ct Weatherford, TX 76088
Estimated Value: $315,816 - $372,000
3
Beds
2
Baths
1,252
Sq Ft
$281/Sq Ft
Est. Value
About This Home
This home is located at 112 Applebee Ct, Weatherford, TX 76088 and is currently estimated at $351,204, approximately $280 per square foot. 112 Applebee Ct is a home located in Parker County with nearby schools including Millsap Elementary School, Millsap Middle School, and Millsap High School.
Ownership History
Date
Name
Owned For
Owner Type
Purchase Details
Closed on
Oct 30, 2015
Sold by
Alloggio Michael and Allogio Samantha
Bought by
Duncan Debbie C
Current Estimated Value
Purchase Details
Closed on
Jun 5, 2013
Sold by
Weaver Curtis
Bought by
Duncan Debbie C
Home Financials for this Owner
Home Financials are based on the most recent Mortgage that was taken out on this home.
Original Mortgage
$122,448
Interest Rate
3.41%
Mortgage Type
New Conventional
Purchase Details
Closed on
Jan 11, 2010
Sold by
Sullivan Stephen M and Sullivan Lindsey
Bought by
Weaver Curtis
Home Financials for this Owner
Home Financials are based on the most recent Mortgage that was taken out on this home.
Original Mortgage
$87,000
Interest Rate
4.8%
Mortgage Type
Purchase Money Mortgage
Purchase Details
Closed on
Nov 9, 2001
Sold by
Robin L Brown Inc
Bought by
Duncan Debbie C
Purchase Details
Closed on
Jul 27, 2001
Sold by
Wcw Limited Partnership
Bought by
Duncan Debbie C
Create a Home Valuation Report for This Property
The Home Valuation Report is an in-depth analysis detailing your home's value as well as a comparison with similar homes in the area
Home Values in the Area
Average Home Value in this Area
Purchase History
| Date | Buyer | Sale Price | Title Company |
|---|---|---|---|
| Duncan Debbie C | -- | Attorney | |
| Duncan Debbie C | -- | -- | |
| Alloggio Michael | -- | None Available | |
| Weaver Curtis | -- | Stnt | |
| Duncan Debbie C | -- | -- | |
| Duncan Debbie C | -- | -- |
Source: Public Records
Mortgage History
| Date | Status | Borrower | Loan Amount |
|---|---|---|---|
| Previous Owner | Alloggio Michael | $122,448 | |
| Previous Owner | Weaver Curtis | $87,000 |
Source: Public Records
Tax History Compared to Growth
Tax History
| Year | Tax Paid | Tax Assessment Tax Assessment Total Assessment is a certain percentage of the fair market value that is determined by local assessors to be the total taxable value of land and additions on the property. | Land | Improvement |
|---|---|---|---|---|
| 2025 | $1,092 | $264,821 | -- | -- |
| 2024 | $1,092 | $240,746 | -- | -- |
| 2023 | $1,092 | $218,860 | $0 | $0 |
| 2022 | $3,775 | $198,970 | $35,000 | $163,970 |
| 2021 | $3,952 | $198,970 | $35,000 | $163,970 |
| 2020 | $3,715 | $176,720 | $25,000 | $151,720 |
| 2019 | $3,622 | $176,720 | $25,000 | $151,720 |
| 2018 | $3,274 | $147,040 | $20,000 | $127,040 |
| 2017 | $3,082 | $147,040 | $20,000 | $127,040 |
| 2016 | $2,802 | $115,990 | $20,000 | $95,990 |
| 2015 | $2,337 | $115,990 | $20,000 | $95,990 |
| 2014 | $2,262 | $105,000 | $20,000 | $85,000 |
Source: Public Records
Map
Nearby Homes
- 2435 Old Mineral Wells Hwy
- 167 Duke Trail
- 1008 Salvation Dr
- 109 Rio Bravo Ct
- 100 Rio Bravo Ct
- 4025 Life Dr
- 4024 Life Dr
- 3024 Truth Ct
- 2097 Redemption Dr
- 2068 Redemption Dr
- 1061 Salvation Dr
- 1033 Salvation Dr
- TBD Old Mineral Wells Hwy
- 1009 Salvation Dr
- 1057 Salvation Dr
- 1017 Salvation Dr
- 1930 Old Mineral Wells Hwy
- Brazos Plan at Freeman Ranch
- Longhorn Plan at Freeman Ranch
- Colorado Plan at Freeman Ranch
- 116 Applebee Ct
- 108 Applebee Ct
- 111 Applebee Ct
- 115 Applebee Ct
- 104 Applebee Ct
- 120 Applebee Ct
- 107 Applebee Ct
- 119 Applebee Ct
- 123 Applebee Ct
- 100 Applebee Ct
- 108 Butternut Ct
- 112 Butternut Ct
- 104 Butternut Ct
- 100 Butternut Ct
- 2450 Old Mineral Wells Hwy
- 128 True Grit Ct
- 136 True Grit Ct
- 2515 Old Mineral Wells Hwy
- 109 Butternut Ct
- 105 Butternut Ct