112 Ashling Dr Lagrange, GA 30240
Estimated Value: $321,128 - $371,000
4
Beds
3
Baths
2,385
Sq Ft
$145/Sq Ft
Est. Value
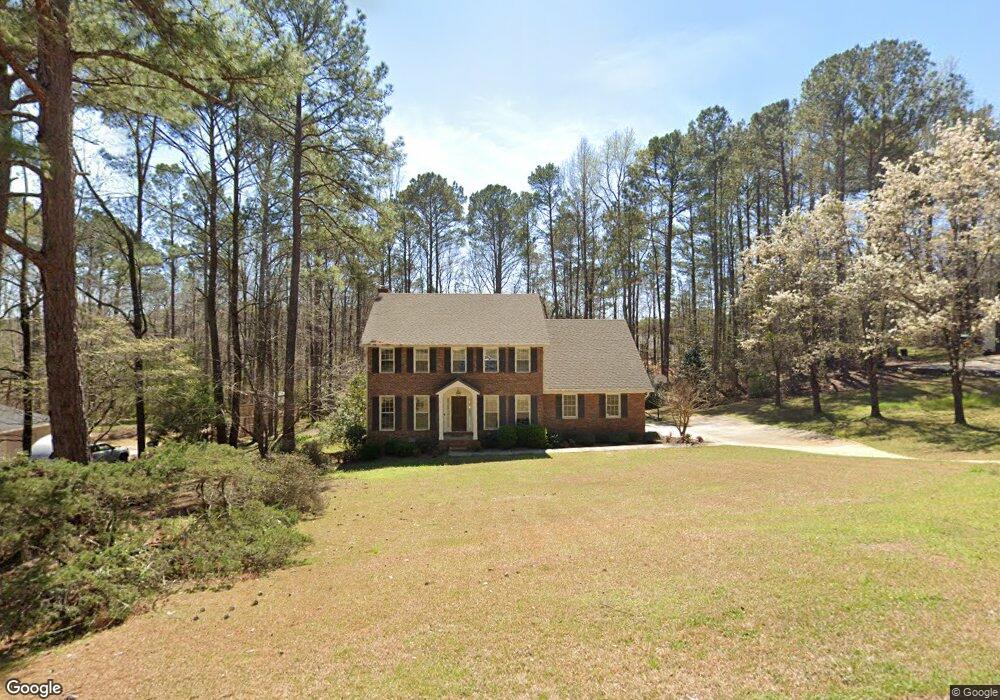
About This Home
This home is located at 112 Ashling Dr, Lagrange, GA 30240 and is currently estimated at $345,282, approximately $144 per square foot. 112 Ashling Dr is a home located in Troup County with nearby schools including Franklin Forest Elementary School, Hollis Hand Elementary School, and Ethel W. Kight Elementary School.
Ownership History
Date
Name
Owned For
Owner Type
Purchase Details
Closed on
Aug 25, 2000
Sold by
David G Traylor
Bought by
Traylor Sally N
Current Estimated Value
Purchase Details
Closed on
Mar 21, 1994
Sold by
Parham Parham and Parham Broadwater
Bought by
David G Traylor
Purchase Details
Closed on
Nov 5, 1993
Sold by
Jackson John M
Bought by
Parham Parham and Parham Broadwater
Purchase Details
Closed on
May 2, 1991
Sold by
Janice Russell G and Janice Grizzle
Bought by
Jackson John M
Purchase Details
Closed on
Aug 1, 1986
Sold by
Erma John and Erma Harbison
Bought by
Janice Russell G and Janice Grizzle
Purchase Details
Closed on
Aug 16, 1983
Sold by
West Ga Estates
Bought by
Erma John and Erma Harbison
Purchase Details
Closed on
Jun 10, 1983
Sold by
Dan Ric and Est Ga Est
Bought by
West Ga Estates
Purchase Details
Closed on
Jun 29, 1982
Bought by
Dan Ric and Est Ga Est
Create a Home Valuation Report for This Property
The Home Valuation Report is an in-depth analysis detailing your home's value as well as a comparison with similar homes in the area
Purchase History
| Date | Buyer | Sale Price | Title Company |
|---|---|---|---|
| Traylor Sally N | -- | -- | |
| David G Traylor | $128,000 | -- | |
| Parham Parham | -- | -- | |
| Jackson John M | $128,900 | -- | |
| Janice Russell G | -- | -- | |
| Erma John | -- | -- | |
| West Ga Estates | -- | -- | |
| Dan Ric | -- | -- |
Source: Public Records
Tax History
| Year | Tax Paid | Tax Assessment Tax Assessment Total Assessment is a certain percentage of the fair market value that is determined by local assessors to be the total taxable value of land and additions on the property. | Land | Improvement |
|---|---|---|---|---|
| 2025 | $3,117 | $122,960 | $18,000 | $104,960 |
| 2024 | $2,788 | $104,200 | $18,000 | $86,200 |
| 2023 | $2,733 | $102,200 | $14,000 | $88,200 |
| 2022 | $2,625 | $96,040 | $14,000 | $82,040 |
| 2021 | $2,191 | $74,640 | $14,000 | $60,640 |
| 2020 | $2,191 | $74,640 | $14,000 | $60,640 |
| 2019 | $1,990 | $67,960 | $12,000 | $55,960 |
| 2018 | $1,810 | $62,000 | $10,160 | $51,840 |
| 2017 | $1,700 | $58,340 | $8,700 | $49,640 |
| 2016 | $1,703 | $58,442 | $8,700 | $49,742 |
| 2015 | $1,751 | $59,938 | $10,196 | $49,742 |
| 2014 | $1,675 | $57,320 | $10,196 | $47,124 |
| 2013 | -- | $63,052 | $10,092 | $52,960 |
Source: Public Records
Map
Nearby Homes
- 1784 Mooty Bridge Rd
- 114 Red Oak Trail
- 115 Meadowland Trail
- 103 Woodchase
- 100 Deer Creek Dr
- 103 Windridge
- 107 Windridge
- 205 River Oaks Dr
- 102 Beech Creek Dr
- 204 Dixie Creek Dr
- 109 Windridge
- 209 River Oaks Dr
- 110 Pond View Point
- 130 Sunny Point Cir
- 91 Richmond Dr
- 203 S Chilton Crescent
- 201 S Chilton Crescent
- 1218 New Franklin Rd
- 732 Camellia Dr
- 724 Camellia Dr
- 110 Ashling Dr
- 114 Ashling Dr
- 107 Saint Anthony Dr
- 107 St Anthony Dr
- 113 Ashling Dr
- 108 Ashling Dr
- 116 Ashling Dr
- 115 Ashling Dr
- 111 Ashling Dr
- 111 Ashling Dr Unit 6
- 111 St Anthony Dr
- 111 St Anthony Dr Unit LOT 5 & 6
- 109 Ashling Dr
- 117 Ashling Dr
- 113 Saint Anthony Dr
- 105 Saint Anthony Dr
- 106 Ashling Dr
- 210 Ridgeview Ct
- 118 Ashling Dr
- 107 Ashling Dr
Your Personal Tour Guide
Ask me questions while you tour the home.