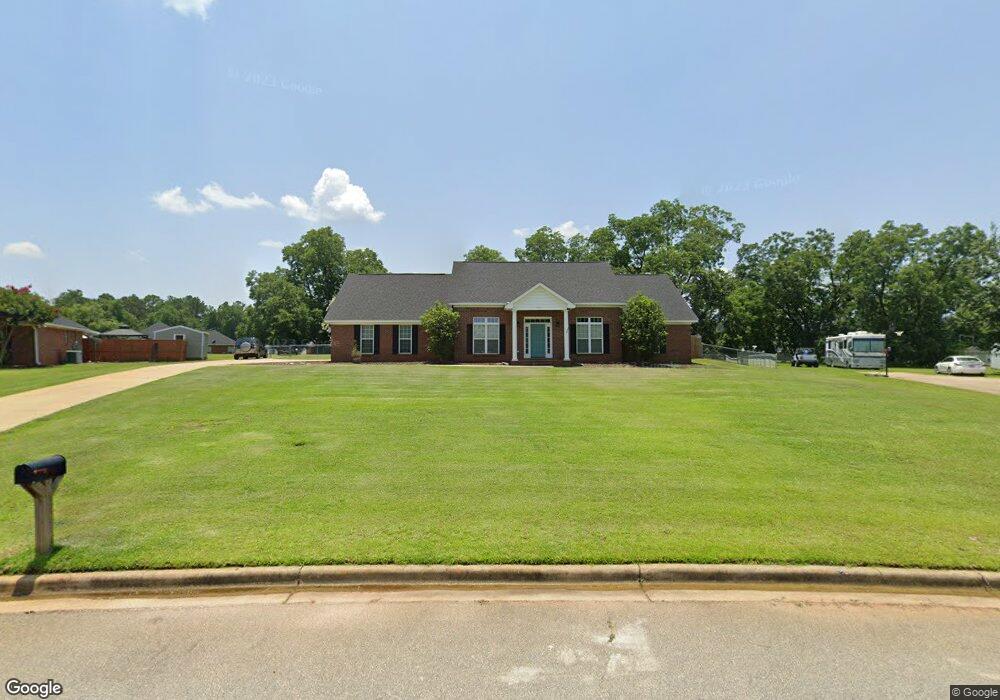
112 Barrondale Dr Leesburg, GA 31763
Estimated Value: $365,512 - $381,000
4
Beds
2
Baths
2,545
Sq Ft
$146/Sq Ft
Est. Value
About This Home
This home is located at 112 Barrondale Dr, Leesburg, GA 31763 and is currently estimated at $370,378, approximately $145 per square foot. 112 Barrondale Dr is a home located in Lee County with nearby schools including Lee County Primary School, Lee County Elementary School, and Lee County Middle School - West Campus.
Ownership History
Date
Name
Owned For
Owner Type
Purchase Details
Closed on
Nov 19, 2021
Sold by
Rose Deron P
Bought by
Kennedy Elizabeth Rose and Kennedy Brantley Malloy
Current Estimated Value
Home Financials for this Owner
Home Financials are based on the most recent Mortgage that was taken out on this home.
Original Mortgage
$222,335
Outstanding Balance
$54,988
Interest Rate
3.09%
Mortgage Type
Commercial
Estimated Equity
$315,390
Purchase Details
Closed on
Sep 6, 2006
Sold by
Braun Joseph M
Bought by
Rose Deron P and Braun Shannon C
Home Financials for this Owner
Home Financials are based on the most recent Mortgage that was taken out on this home.
Original Mortgage
$216,000
Interest Rate
6.52%
Mortgage Type
New Conventional
Purchase Details
Closed on
Aug 1, 2004
Sold by
Ray Lloyd Realty
Bought by
Braun Joseph M and Braun Shannon C
Purchase Details
Closed on
Mar 1, 2004
Sold by
Holly Plantation Partners
Bought by
Ray Lloyd Realty
Create a Home Valuation Report for This Property
The Home Valuation Report is an in-depth analysis detailing your home's value as well as a comparison with similar homes in the area
Home Values in the Area
Average Home Value in this Area
Purchase History
| Date | Buyer | Sale Price | Title Company |
|---|---|---|---|
| Kennedy Elizabeth Rose | $270,000 | -- | |
| Rose Deron P | $227,400 | -- | |
| Braun Joseph M | $198,900 | -- | |
| Ray Lloyd Realty | $29,500 | -- |
Source: Public Records
Mortgage History
| Date | Status | Borrower | Loan Amount |
|---|---|---|---|
| Open | Kennedy Elizabeth Rose | $222,335 | |
| Previous Owner | Rose Deron P | $216,000 |
Source: Public Records
Tax History Compared to Growth
Tax History
| Year | Tax Paid | Tax Assessment Tax Assessment Total Assessment is a certain percentage of the fair market value that is determined by local assessors to be the total taxable value of land and additions on the property. | Land | Improvement |
|---|---|---|---|---|
| 2024 | $3,096 | $104,440 | $8,000 | $96,440 |
| 2023 | $2,888 | $104,440 | $8,000 | $96,440 |
| 2022 | $2,828 | $100,360 | $8,000 | $92,360 |
| 2021 | $2,778 | $100,360 | $8,000 | $92,360 |
| 2020 | $2,539 | $78,640 | $11,680 | $66,960 |
| 2019 | $2,584 | $78,640 | $11,680 | $66,960 |
| 2018 | $2,585 | $78,640 | $11,680 | $66,960 |
| 2017 | $2,447 | $78,640 | $11,680 | $66,960 |
| 2016 | $2,447 | $78,640 | $11,680 | $66,960 |
| 2015 | $2,460 | $78,640 | $11,680 | $66,960 |
| 2014 | $2,916 | $92,520 | $13,720 | $78,800 |
| 2013 | -- | $92,520 | $13,720 | $78,800 |
Source: Public Records
Map
Nearby Homes
- 260 Hawkstead Dr
- 112 Beowulf Ln
- 107 Beowulf Ln
- 307 Ambleside Dr
- 324 Ambleside Dr
- 695 Winifred Rd
- 4922 van Cise Ln
- 252 Wiregrass Way
- 123 Larkspur Dr
- 122 Bay Ct
- 2624 Crofton Dr
- 227 Longleaf Dr
- 2813 W Doublegate Dr
- 4817 Coachlight Ct
- 3811 Burton Ct
- 3806 Burton Ct
- 3805 Burton Ct
- 3803 Gateway Ave
- 2507 Daylor Ct
- 102 Fair Oaks Ct
- 108 Barrondale Dr
- 116 Barrondale Dr
- 202 Hawkstead Dr
- 206 Hawkstead Dr
- 196 Hawkstead Dr
- 190 Hawkstead Dr
- 210 Hawkstead Dr
- 109 Barrondale Dr
- 104 Barrondale Dr
- 120 Barrondale Dr
- 212 Ambleside Dr
- 184 Hawkstead Dr
- 214 Hawkstead Dr
- 214 Ambleside Dr
- 117 Barrondale Dr
- 210 Ambleside Dr
- 122 Barrondale Dr
- 218 Ambleside Dr
- 178 Hawkstead Dr
- 222 Hawkstead Dr