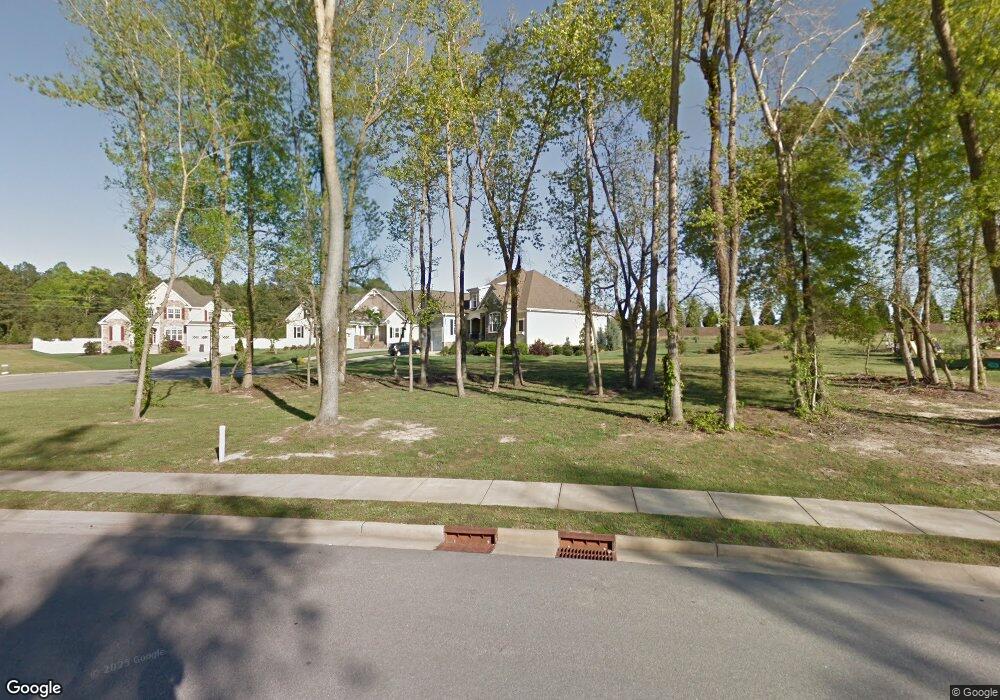
112 Beckwith Ave Clayton, NC 27527
Wilders NeighborhoodEstimated Value: $563,000 - $642,000
4
Beds
3
Baths
2,607
Sq Ft
$234/Sq Ft
Est. Value
About This Home
This home is located at 112 Beckwith Ave, Clayton, NC 27527 and is currently estimated at $610,479, approximately $234 per square foot. 112 Beckwith Ave is a home located in Johnston County with nearby schools including River Dell Elementary School, Archer Lodge Middle School, and Corinth Holders High School.
Ownership History
Date
Name
Owned For
Owner Type
Purchase Details
Closed on
Oct 13, 2014
Sold by
Grey Heron Construction Inc
Bought by
Guillou Thomas and Guillou Terrie Sue
Current Estimated Value
Home Financials for this Owner
Home Financials are based on the most recent Mortgage that was taken out on this home.
Original Mortgage
$357,286
Outstanding Balance
$272,391
Interest Rate
3.95%
Mortgage Type
New Conventional
Estimated Equity
$338,088
Purchase Details
Closed on
Jun 5, 2014
Sold by
Finch Joshua Flowers
Bought by
Grey Heron Construction Inc
Home Financials for this Owner
Home Financials are based on the most recent Mortgage that was taken out on this home.
Original Mortgage
$281,700
Interest Rate
4.28%
Mortgage Type
Future Advance Clause Open End Mortgage
Purchase Details
Closed on
Nov 27, 2012
Sold by
Dwf Development Inc
Bought by
Finch Joshua Flowers
Create a Home Valuation Report for This Property
The Home Valuation Report is an in-depth analysis detailing your home's value as well as a comparison with similar homes in the area
Home Values in the Area
Average Home Value in this Area
Purchase History
| Date | Buyer | Sale Price | Title Company |
|---|---|---|---|
| Guillou Thomas | $397,000 | None Available | |
| Grey Heron Construction Inc | $48,000 | None Available | |
| Finch Joshua Flowers | -- | None Available |
Source: Public Records
Mortgage History
| Date | Status | Borrower | Loan Amount |
|---|---|---|---|
| Open | Guillou Thomas | $357,286 | |
| Previous Owner | Grey Heron Construction Inc | $281,700 |
Source: Public Records
Tax History Compared to Growth
Tax History
| Year | Tax Paid | Tax Assessment Tax Assessment Total Assessment is a certain percentage of the fair market value that is determined by local assessors to be the total taxable value of land and additions on the property. | Land | Improvement |
|---|---|---|---|---|
| 2025 | $4,260 | $670,820 | $80,000 | $590,820 |
| 2024 | $3,931 | $485,250 | $50,000 | $435,250 |
| 2023 | $3,121 | $385,330 | $50,000 | $335,330 |
| 2022 | $3,160 | $385,330 | $50,000 | $335,330 |
| 2021 | $3,160 | $385,330 | $50,000 | $335,330 |
| 2020 | $3,275 | $385,330 | $50,000 | $335,330 |
| 2019 | $3,275 | $385,330 | $50,000 | $335,330 |
| 2018 | $3,289 | $378,090 | $50,000 | $328,090 |
| 2017 | $3,214 | $378,090 | $50,000 | $328,090 |
| 2016 | $3,214 | $378,090 | $50,000 | $328,090 |
| 2015 | $425 | $378,090 | $50,000 | $328,090 |
| 2014 | $425 | $50,000 | $50,000 | $0 |
Source: Public Records
Map
Nearby Homes
- 65 Oglethorpe Ave
- 15 Drayton St
- 72 Little Leaf Ln
- 225 Beckwith Ave
- 135 Flowers Pkwy
- 91 Little Leaf Ln Unit 103
- 85 Little Leaf Ln
- 71 Little Leaf Ln Unit 99
- 67 Little Leaf Ln Unit 98
- 109 Periwinkle Place
- 163 Periwinkle Place
- 80 Willow Green Dr
- 88 White Pine Dr
- 80 Bramble Ln
- 76 N District Ave
- 362 Beckwith Ave
- 65 Balsam Ln
- 47 White Pine Dr
- 46 Woods Manor Ln
- 153 N District Ave
- 16 Penninah Ave
- 16 Penninah Ave Unit 3
- 16 Penninah Ct
- 16 Penninah Ct Unit 3
- 16 Peninah Ct Unit 3
- 32 Penninah Ct
- 32 Penninah Ct Unit Lt4
- 80 Beckwith Ave
- 80 Beckwith Ave Unit Lt2
- 131 Beckwith Ave
- 83 Beckwith Ave
- 15 Penninah Ct
- 15 Penninah Ct Unit Lt8
- 36 Penninah Ct
- 42 Beckwith Ave
- 37 Penninah Ct
- 37 Penninah Ct Unit Lt6
- 31 Penninah Ct
- 31 Penninah Ct Unit 7
- 59 Beckwith Ave