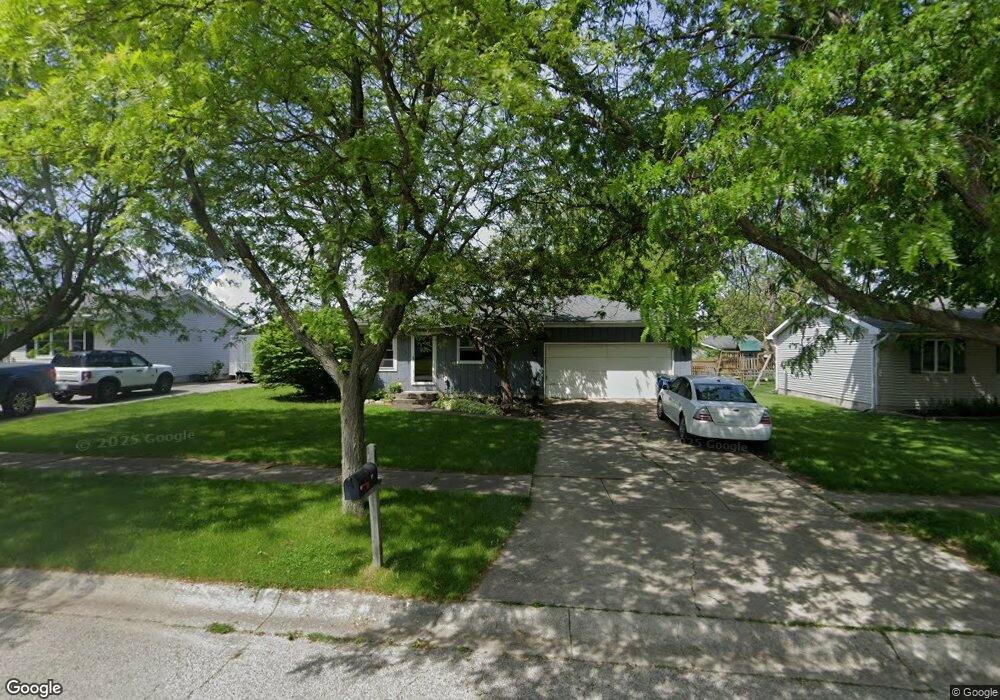
112 Beech Ct Hebron, IN 46341
Porter County NeighborhoodEstimated Value: $223,000 - $233,000
3
Beds
1
Bath
1,120
Sq Ft
$203/Sq Ft
Est. Value
About This Home
This home is located at 112 Beech Ct, Hebron, IN 46341 and is currently estimated at $227,628, approximately $203 per square foot. 112 Beech Ct is a home located in Porter County with nearby schools including Hebron Elementary School, Hebron Middle School, and Hebron High School.
Ownership History
Date
Name
Owned For
Owner Type
Purchase Details
Closed on
Jul 6, 2015
Sold by
Cruise Tai K and Cruise Heather
Bought by
Moskalich Tara A
Current Estimated Value
Home Financials for this Owner
Home Financials are based on the most recent Mortgage that was taken out on this home.
Original Mortgage
$127,551
Outstanding Balance
$97,662
Interest Rate
3.83%
Mortgage Type
New Conventional
Estimated Equity
$129,966
Create a Home Valuation Report for This Property
The Home Valuation Report is an in-depth analysis detailing your home's value as well as a comparison with similar homes in the area
Home Values in the Area
Average Home Value in this Area
Purchase History
| Date | Buyer | Sale Price | Title Company |
|---|---|---|---|
| Moskalich Tara A | -- | Liberty Title |
Source: Public Records
Mortgage History
| Date | Status | Borrower | Loan Amount |
|---|---|---|---|
| Open | Moskalich Tara A | $127,551 |
Source: Public Records
Tax History
| Year | Tax Paid | Tax Assessment Tax Assessment Total Assessment is a certain percentage of the fair market value that is determined by local assessors to be the total taxable value of land and additions on the property. | Land | Improvement |
|---|---|---|---|---|
| 2025 | $2,179 | $205,100 | $31,400 | $173,700 |
| 2024 | $2,066 | $196,200 | $29,300 | $166,900 |
| 2023 | $1,953 | $187,900 | $27,500 | $160,400 |
| 2022 | $1,926 | $176,100 | $27,500 | $148,600 |
| 2021 | $1,585 | $144,000 | $27,500 | $116,500 |
| 2020 | $1,483 | $135,600 | $25,000 | $110,600 |
| 2019 | $1,417 | $129,900 | $25,000 | $104,900 |
| 2018 | $1,390 | $124,700 | $25,000 | $99,700 |
| 2017 | $1,283 | $118,600 | $25,000 | $93,600 |
| 2016 | $1,300 | $120,500 | $24,400 | $96,100 |
| 2014 | $1,361 | $122,900 | $24,600 | $98,300 |
| 2013 | -- | $115,600 | $24,700 | $90,900 |
Source: Public Records
Map
Nearby Homes
Your Personal Tour Guide
Ask me questions while you tour the home.