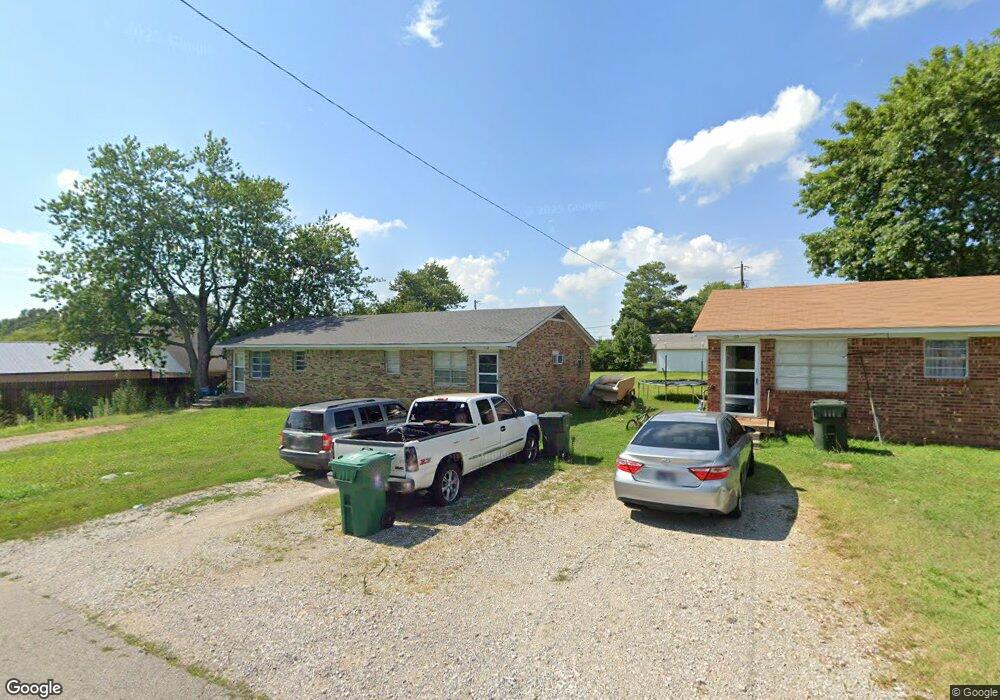
112 Bell St Unit 114 Rutherford, TN 38369
Estimated Value: $97,543 - $252,000
Studio
2
Baths
1,430
Sq Ft
$136/Sq Ft
Est. Value
About This Home
This home is located at 112 Bell St Unit 114, Rutherford, TN 38369 and is currently estimated at $193,886, approximately $135 per square foot. 112 Bell St Unit 114 is a home located in Gibson County with nearby schools including Rutherford Elementary School and Gibson County High School.
Ownership History
Date
Name
Owned For
Owner Type
Purchase Details
Closed on
Feb 28, 2013
Sold by
Morris Wayne
Bought by
Hazlewood Josh B
Current Estimated Value
Purchase Details
Closed on
Mar 28, 2001
Sold by
Hayes Heidi K and Hayes Thomas W
Bought by
Morris Brenda and Morris Wayne
Purchase Details
Closed on
Mar 17, 1972
Bought by
Bradford Thomas A and Bradford Marilyn D
Purchase Details
Closed on
Nov 30, 1968
Purchase Details
Closed on
Jan 4, 1900
Purchase Details
Closed on
Jan 3, 1900
Create a Home Valuation Report for This Property
The Home Valuation Report is an in-depth analysis detailing your home's value as well as a comparison with similar homes in the area
Purchase History
| Date | Buyer | Sale Price | Title Company |
|---|---|---|---|
| Hazlewood Josh B | $77,000 | -- | |
| Morris Brenda | $110,000 | -- | |
| Bradford Thomas A | -- | -- | |
| -- | -- | -- | |
| -- | -- | -- | |
| -- | -- | -- |
Source: Public Records
Tax History
| Year | Tax Paid | Tax Assessment Tax Assessment Total Assessment is a certain percentage of the fair market value that is determined by local assessors to be the total taxable value of land and additions on the property. | Land | Improvement |
|---|---|---|---|---|
| 2025 | $1,052 | $27,560 | $2,200 | $25,360 |
| 2024 | $952 | $27,560 | $2,200 | $25,360 |
| 2023 | $556 | $17,880 | $2,040 | $15,840 |
| 2022 | $544 | $17,880 | $2,040 | $15,840 |
| 2021 | $544 | $17,880 | $2,040 | $15,840 |
| 2020 | $891 | $17,880 | $2,040 | $15,840 |
| 2019 | $864 | $17,880 | $2,040 | $15,840 |
| 2018 | $924 | $18,600 | $2,040 | $16,560 |
| 2017 | $896 | $18,600 | $2,040 | $16,560 |
| 2016 | $915 | $18,600 | $2,040 | $16,560 |
| 2015 | $816 | $18,600 | $2,040 | $16,560 |
| 2014 | $816 | $18,600 | $2,040 | $16,560 |
Source: Public Records
Map
Nearby Homes
- 201 Cross St
- 113 N West St
- 531 W Knox St
- 511 W Knox St
- 944 Mcknight St
- 516 W Knox St
- 321 W Main St
- 130 Callis Dr
- 112 Fox St
- 105 S Trenton St
- 107 Hopper St
- 228 SE Front St
- 201 E Main St
- 0 Rutherford-Kenton & Hwy 45 Bypass W Unit 2601305
- 23 Gravettes Crossing Rd W
- 0 Rutherford-Kenton Rd & Hwy 45 Bypass W Unit RRA46254
- 205 Division St
- 208 & 210 Lee St
- 403 E College St
- 115 High St
- 108 Bell St Unit 110
- 106 Waldunn Cove
- 104 Bell St Unit 106
- 211 Allen St
- 209 Allen St
- 110 Waldunn Cove
- 102 Bell St
- 205 Allen St
- 107 Hilltop St
- 114 Waldunn Cove
- 105 Waldunn Cove
- 101 Waldunn Cove
- 201 Hilltop St
- 109 Waldunn Cove
- 205 Cross St
- 118 Waldunn Cove
- 113 Waldunn Cove
- 707 W Main St
- 109 N West St
- 109 N West St
Your Personal Tour Guide
Ask me questions while you tour the home.