112 Boardwalk St Unit 1126 Elk Grove Village, IL 60007
Elk Grove Village East NeighborhoodEstimated Value: $151,122 - $176,000
2
Beds
--
Bath
4,800
Sq Ft
$35/Sq Ft
Est. Value
About This Home
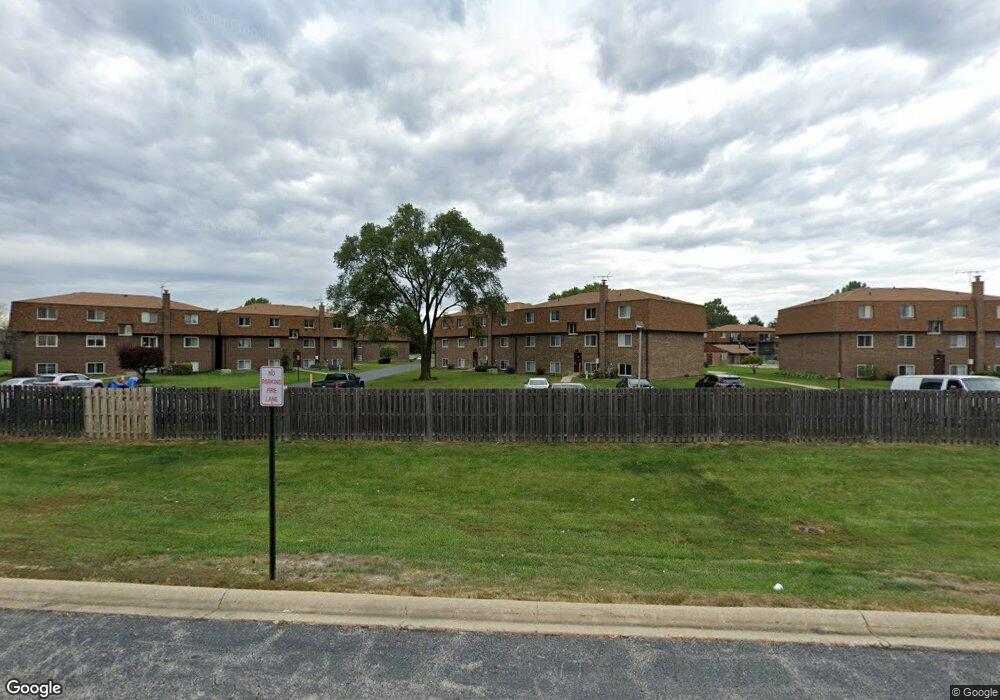
This home is located at 112 Boardwalk St Unit 1126, Elk Grove Village, IL 60007 and is currently estimated at $168,281, approximately $35 per square foot. 112 Boardwalk St Unit 1126 is a home located in Cook County with nearby schools including Salt Creek Elementary School, Grove Jr High School, and Elk Grove High School.
Ownership History
Date
Name
Owned For
Owner Type
Purchase Details
Closed on
Jan 26, 2016
Sold by
Rowe Mark
Bought by
Casica Susan
Current Estimated Value
Purchase Details
Closed on
Nov 28, 2004
Sold by
Omalley William B and Rowe Susan G
Bought by
Rowe Mark Kenneth and Rowe Susan G
Purchase Details
Closed on
Jan 20, 2000
Sold by
Casica Anthony
Bought by
Rowe Susan G
Purchase Details
Closed on
Sep 29, 1997
Sold by
Merdian Mark
Bought by
Casica Anthony J and Omalley William B
Home Financials for this Owner
Home Financials are based on the most recent Mortgage that was taken out on this home.
Original Mortgage
$48,500
Interest Rate
7.7%
Purchase Details
Closed on
Jan 31, 1997
Sold by
Burnett Annette and Burnett Joseph A
Bought by
Merdian Mark
Purchase Details
Closed on
Jan 30, 1997
Sold by
Nollner Cynthia J
Bought by
Merdian Mark
Create a Home Valuation Report for This Property
The Home Valuation Report is an in-depth analysis detailing your home's value as well as a comparison with similar homes in the area
Home Values in the Area
Average Home Value in this Area
Purchase History
| Date | Buyer | Sale Price | Title Company |
|---|---|---|---|
| Casica Susan | -- | None Available | |
| Rowe Mark Kenneth | -- | -- | |
| Rowe Susan G | -- | -- | |
| Casica Anthony J | $41,333 | -- | |
| Merdian Mark | $38,000 | -- | |
| Merdian Mark | -- | Attorneys Natl Title Network |
Source: Public Records
Mortgage History
| Date | Status | Borrower | Loan Amount |
|---|---|---|---|
| Previous Owner | Casica Anthony J | $48,500 |
Source: Public Records
Tax History Compared to Growth
Tax History
| Year | Tax Paid | Tax Assessment Tax Assessment Total Assessment is a certain percentage of the fair market value that is determined by local assessors to be the total taxable value of land and additions on the property. | Land | Improvement |
|---|---|---|---|---|
| 2024 | $1,536 | $9,365 | $1,943 | $7,422 |
| 2023 | $1,452 | $9,365 | $1,943 | $7,422 |
| 2022 | $1,452 | $9,365 | $1,943 | $7,422 |
| 2021 | $1,280 | $7,940 | $1,200 | $6,740 |
| 2020 | $1,294 | $7,940 | $1,200 | $6,740 |
| 2019 | $1,329 | $8,887 | $1,200 | $7,687 |
| 2018 | $541 | $5,408 | $1,028 | $4,380 |
| 2017 | $554 | $5,408 | $1,028 | $4,380 |
| 2016 | $741 | $5,408 | $1,028 | $4,380 |
| 2015 | $737 | $5,376 | $914 | $4,462 |
| 2014 | $741 | $5,376 | $914 | $4,462 |
| 2013 | $709 | $5,376 | $914 | $4,462 |
Source: Public Records
Map
Nearby Homes
- 115 Boardwalk St Unit 2E
- 104 Boardwalk St Unit 2E
- 850 Wellington Ave Unit 304
- 898 Wellington Ave Unit 202
- 840 Wellington Ave Unit 315
- 840 Wellington Ave Unit 318
- 700 Wellington Ave Unit 406
- 700 Wellington Ave Unit 419
- 520 Biesterfield Rd Unit D318
- 815 Leicester Rd Unit A211
- 805 Leicester Rd Unit B118
- 805 Leicester Rd Unit B320
- 805 Leicester Rd Unit B105
- 648 Dauphine Ct Unit F
- 910 Lonsdale Rd
- 50 Kendal Rd
- 76 Grange Rd
- 579 Bristol Ln
- 679 W Elk Grove Blvd
- 104 Parkchester Rd
- 112 Boardwalk St Unit 1123
- 112 Boardwalk St Unit 1125
- 112 Boardwalk St Unit 1121
- 112 Boardwalk St Unit 1122
- 112 Boardwalk St Unit GW
- 112 Boardwalk St Unit 2W
- 112 Boardwalk St Unit 2E
- 112 Boardwalk St Unit 1W
- 112 Boardwalk St Unit 1E
- 110 Boardwalk St Unit 1106
- 110 Boardwalk St Unit 1103
- 110 Boardwalk St Unit 1104
- 110 Boardwalk St Unit 1105
- 110 Boardwalk St Unit 1101
- 110 Boardwalk St Unit 1E
- 103 S Arlington Heights Rd Unit 6
- 107 S Arlington Heights Rd Unit 3
- 103 S Arlington Heights Rd Unit 4
- 107 S Arlington Heights Rd Unit 2
- 114 Boardwalk St Unit GE