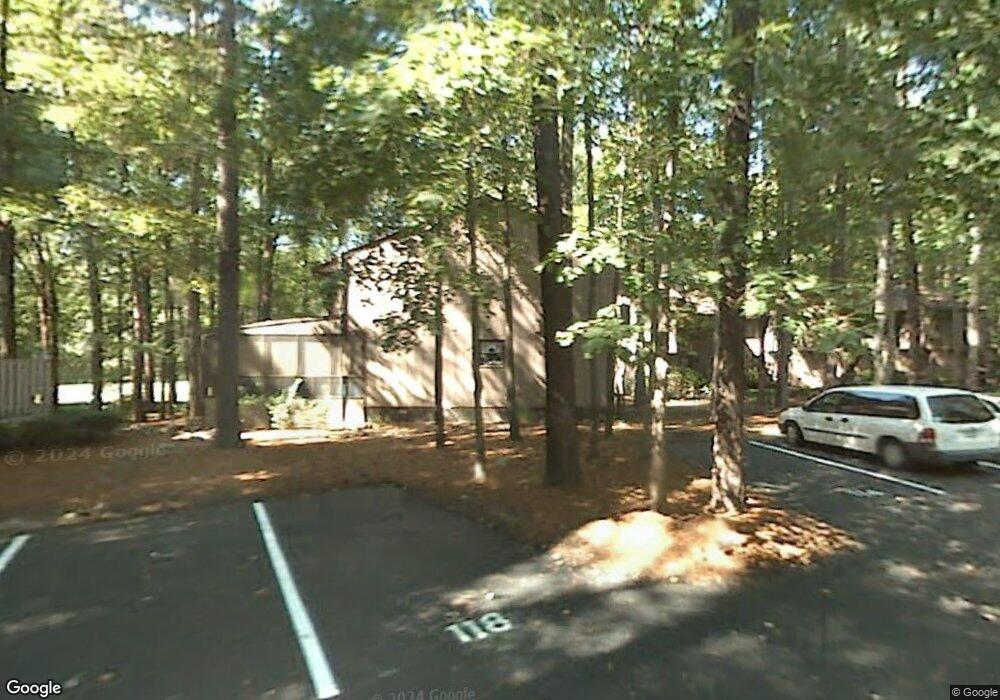
112 Bogue Ct Cary, NC 27511
South Cary NeighborhoodEstimated Value: $319,000 - $363,000
3
Beds
3
Baths
1,731
Sq Ft
$198/Sq Ft
Est. Value
About This Home
This home is located at 112 Bogue Ct, Cary, NC 27511 and is currently estimated at $342,423, approximately $197 per square foot. 112 Bogue Ct is a home located in Wake County with nearby schools including Briarcliff Elementary School, East Cary Middle School, and Cary High School.
Ownership History
Date
Name
Owned For
Owner Type
Purchase Details
Closed on
Nov 2, 2017
Sold by
Boucher Edna H
Bought by
Dickam Nobert A
Current Estimated Value
Purchase Details
Closed on
Sep 15, 2014
Sold by
Sutton Vivienne Elaine
Bought by
Boucher Edna H
Home Financials for this Owner
Home Financials are based on the most recent Mortgage that was taken out on this home.
Original Mortgage
$148,200
Interest Rate
4.19%
Mortgage Type
New Conventional
Purchase Details
Closed on
Nov 2, 2009
Sold by
Panepinto John C and Panepinto Melanie D
Bought by
Sutton Joseph E and Sutton Vivienne Elaine
Home Financials for this Owner
Home Financials are based on the most recent Mortgage that was taken out on this home.
Original Mortgage
$100,000
Interest Rate
5.04%
Mortgage Type
New Conventional
Purchase Details
Closed on
Jul 14, 1998
Sold by
Chanda Sanjay
Bought by
Panepinto John C and Panepinto Melanie D
Home Financials for this Owner
Home Financials are based on the most recent Mortgage that was taken out on this home.
Original Mortgage
$107,600
Interest Rate
7.02%
Create a Home Valuation Report for This Property
The Home Valuation Report is an in-depth analysis detailing your home's value as well as a comparison with similar homes in the area
Home Values in the Area
Average Home Value in this Area
Purchase History
| Date | Buyer | Sale Price | Title Company |
|---|---|---|---|
| Dickam Nobert A | $156,000 | None Available | |
| Boucher Edna H | $156,000 | None Available | |
| Sutton Joseph E | $152,000 | None Available | |
| Panepinto John C | $120,000 | -- |
Source: Public Records
Mortgage History
| Date | Status | Borrower | Loan Amount |
|---|---|---|---|
| Previous Owner | Boucher Edna H | $148,200 | |
| Previous Owner | Sutton Joseph E | $100,000 | |
| Previous Owner | Panepinto John C | $107,600 |
Source: Public Records
Tax History Compared to Growth
Tax History
| Year | Tax Paid | Tax Assessment Tax Assessment Total Assessment is a certain percentage of the fair market value that is determined by local assessors to be the total taxable value of land and additions on the property. | Land | Improvement |
|---|---|---|---|---|
| 2025 | $3,029 | $351,085 | $115,000 | $236,085 |
| 2024 | $2,964 | $351,085 | $115,000 | $236,085 |
| 2023 | $2,133 | $210,850 | $48,000 | $162,850 |
| 2022 | $2,054 | $210,850 | $48,000 | $162,850 |
| 2021 | $2,013 | $210,850 | $48,000 | $162,850 |
| 2020 | $2,023 | $210,850 | $48,000 | $162,850 |
| 2019 | $1,762 | $162,702 | $50,000 | $112,702 |
| 2018 | $1,654 | $162,702 | $50,000 | $112,702 |
| 2017 | $1,590 | $162,702 | $50,000 | $112,702 |
| 2016 | $1,566 | $162,702 | $50,000 | $112,702 |
| 2015 | $1,309 | $130,896 | $30,000 | $100,896 |
| 2014 | -- | $130,896 | $30,000 | $100,896 |
Source: Public Records
Map
Nearby Homes
- 103 Lakeway Ct
- 103 Bonnell Ct
- 107 Bonnell Ct
- 205 Kingsmill Rd
- 205 Carmichael Ct Unit 13A
- 210 Crimmons Cir
- 101 Flora McDonald Ln
- 300 Mainsail Dr
- 113 Spring Cove Dr
- 216 Climbing Ivy Ct
- 204 Okelly Ln
- 102 Climbing Ivy Ct
- 122 Clancy Cir
- 501 Queensferry Rd
- 114 Drummond Place
- 109 Prince William Ln
- 1215 Brookgreen Dr
- 141 Riverwalk Cir
- 104 Pickett Ln
- 109 Grey Fox Ct
- 114 Bogue Ct
- 110 Bogue Ct
- 116 Bogue Ct
- 108 Bogue Ct
- 118 Bogue Ct
- 106 Bogue Ct
- 104 Bogue Ct
- 102 Bogue Ct
- 120 Bogue Ct
- 122 Bogue Ct
- 124 Bogue Ct
- 101 Bogue Ct Unit H2
- 111 Bogue Ct
- 113 Bogue Ct Unit F1
- 103 Bogue Ct Unit H1
- 107 Bogue Ct Unit G2
- 105 Bogue Ct Unit G3
- 109 Bogue Ct
- 452 Pebble Creek Dr
- 512 Pebble Creek Dr