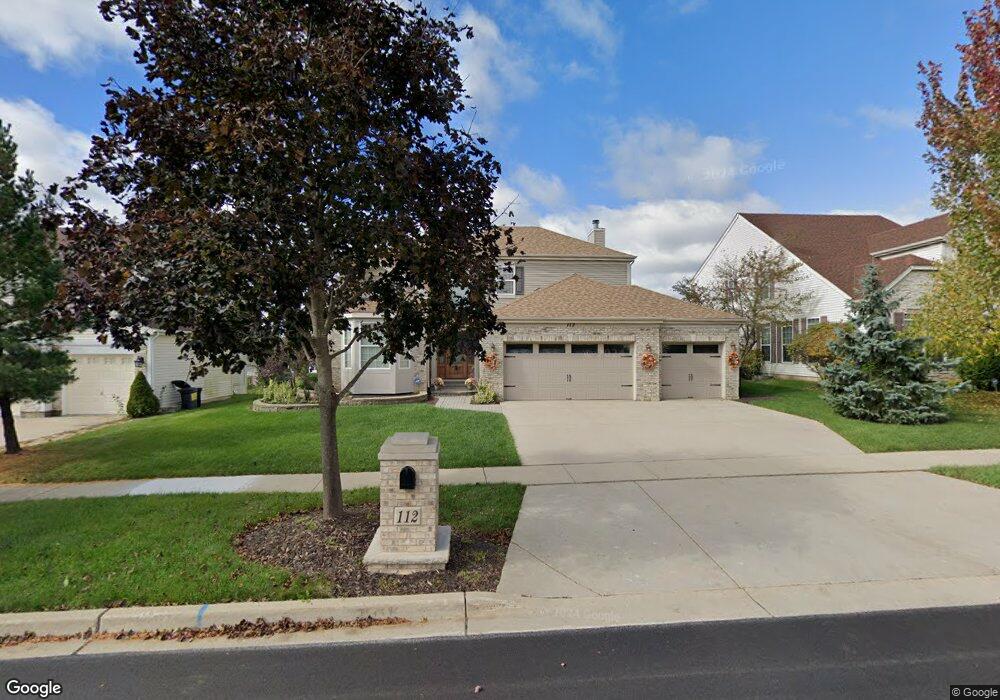
112 Buckskin Ln Streamwood, IL 60107
Estimated Value: $500,000 - $539,000
3
Beds
3
Baths
2,608
Sq Ft
$198/Sq Ft
Est. Value
About This Home
This home is located at 112 Buckskin Ln, Streamwood, IL 60107 and is currently estimated at $517,679, approximately $198 per square foot. 112 Buckskin Ln is a home located in Cook County with nearby schools including Hilltop Elementary School, Canton Middle School, and Streamwood High School.
Ownership History
Date
Name
Owned For
Owner Type
Purchase Details
Closed on
Oct 24, 2023
Sold by
Adamowicz James and Adamowicz Kimberly
Bought by
Grantors James M Adamowicz Declaration Living and Kimberly Kelley-Adamowicz Declaration Living
Current Estimated Value
Purchase Details
Closed on
Apr 2, 2004
Sold by
Fuller David G and Fuller Mary B
Bought by
Adamowicz James and Kelley Kimberly
Home Financials for this Owner
Home Financials are based on the most recent Mortgage that was taken out on this home.
Original Mortgage
$325,600
Interest Rate
5.66%
Mortgage Type
Unknown
Purchase Details
Closed on
Nov 20, 2001
Sold by
Suncrest Llc
Bought by
Fuller David G and Fuller Mary B
Home Financials for this Owner
Home Financials are based on the most recent Mortgage that was taken out on this home.
Original Mortgage
$275,000
Interest Rate
6.62%
Mortgage Type
Balloon
Create a Home Valuation Report for This Property
The Home Valuation Report is an in-depth analysis detailing your home's value as well as a comparison with similar homes in the area
Home Values in the Area
Average Home Value in this Area
Purchase History
| Date | Buyer | Sale Price | Title Company |
|---|---|---|---|
| Grantors James M Adamowicz Declaration Living | -- | None Listed On Document | |
| Adamowicz James | $407,000 | Pntn | |
| Fuller David G | $378,500 | 1St American Title |
Source: Public Records
Mortgage History
| Date | Status | Borrower | Loan Amount |
|---|---|---|---|
| Previous Owner | Adamowicz James | $325,600 | |
| Previous Owner | Fuller David G | $275,000 | |
| Closed | Fuller David G | $33,000 | |
| Closed | Adamowicz James | $61,050 |
Source: Public Records
Tax History Compared to Growth
Tax History
| Year | Tax Paid | Tax Assessment Tax Assessment Total Assessment is a certain percentage of the fair market value that is determined by local assessors to be the total taxable value of land and additions on the property. | Land | Improvement |
|---|---|---|---|---|
| 2024 | $10,476 | $37,001 | $6,284 | $30,717 |
| 2023 | $10,181 | $37,001 | $6,284 | $30,717 |
| 2022 | $10,181 | $37,001 | $6,284 | $30,717 |
| 2021 | $8,962 | $27,565 | $4,817 | $22,748 |
| 2020 | $8,894 | $27,565 | $4,817 | $22,748 |
| 2019 | $8,773 | $30,628 | $4,817 | $25,811 |
| 2018 | $8,223 | $26,618 | $4,189 | $22,429 |
| 2017 | $9,722 | $31,155 | $4,189 | $26,966 |
| 2016 | $10,146 | $33,568 | $4,189 | $29,379 |
| 2015 | $8,588 | $26,616 | $3,770 | $22,846 |
| 2014 | $8,479 | $26,616 | $3,770 | $22,846 |
| 2013 | $10,149 | $32,401 | $3,770 | $28,631 |
Source: Public Records
Map
Nearby Homes
- 617 Tanglewood Dr Unit 4
- 3 Taylor Ct Unit B
- 104 Cottonwood Dr Unit 2
- 29 N Walnut Ct
- 8 Taft Ct Unit A
- 117 Marryat Place
- 422 Tanglewood Dr
- 20 Coolidge Ct Unit B
- 406 Cahill Rd
- 627 Ascot Ln
- 1420 Yellowstone Dr
- 24 Fillmore Ln
- 16 Moraine Dr
- 1301 Little John Dr
- 1504 Laurel Oaks Dr
- 345 Ascot Ln
- 40 Jackson Ln
- 1463 Yellowstone Dr
- 107 Janet Ave
- 14 Buchanan Ln