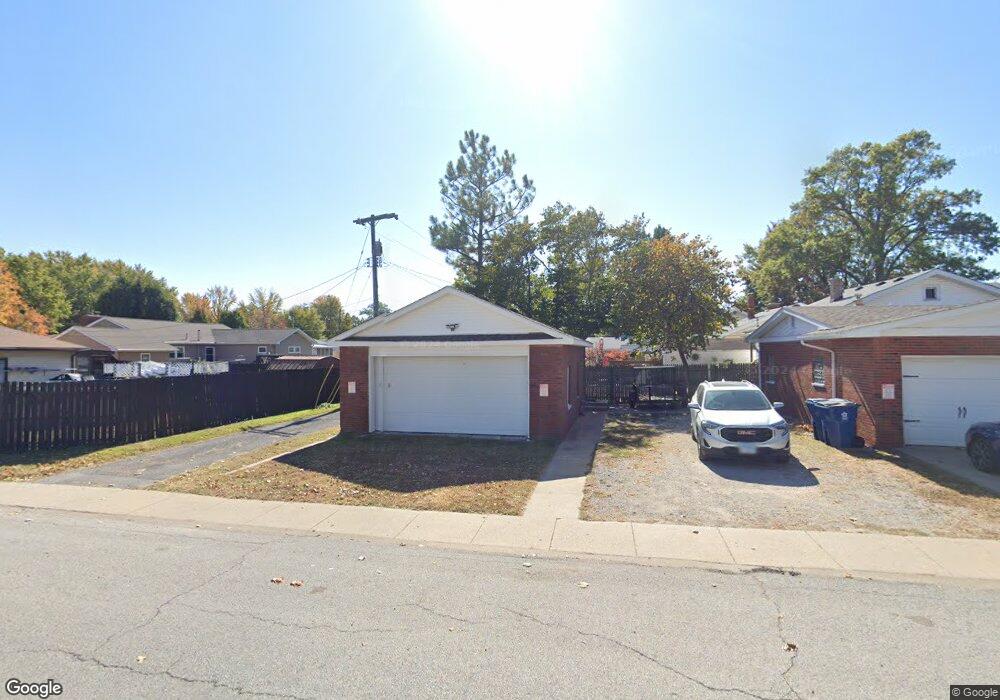
112 Carringer Place Wood River, IL 62095
Estimated Value: $120,000 - $146,065
2
Beds
1
Bath
1,143
Sq Ft
$118/Sq Ft
Est. Value
About This Home
This home is located at 112 Carringer Place, Wood River, IL 62095 and is currently estimated at $135,016, approximately $118 per square foot. 112 Carringer Place is a home located in Madison County with nearby schools including Eastwood Elementary School, East Alton Middle School, and East Alton-Wood River High School.
Ownership History
Date
Name
Owned For
Owner Type
Purchase Details
Closed on
Oct 10, 2022
Sold by
Smith Rhett C and Starnes Cathy M
Bought by
Smith Rhett C and Smith Cathy M
Current Estimated Value
Home Financials for this Owner
Home Financials are based on the most recent Mortgage that was taken out on this home.
Original Mortgage
$113,960
Outstanding Balance
$109,438
Interest Rate
5.75%
Mortgage Type
FHA
Estimated Equity
$25,578
Purchase Details
Closed on
Jun 11, 2020
Sold by
Towner Stan and Towner Nicholas
Bought by
Smith Rhett C and Starnes Cathy M
Home Financials for this Owner
Home Financials are based on the most recent Mortgage that was taken out on this home.
Original Mortgage
$90,233
Interest Rate
3.13%
Mortgage Type
FHA
Purchase Details
Closed on
Aug 28, 2014
Sold by
Lesicko Dan M
Bought by
Towner Stan and Towner Nicholas
Purchase Details
Closed on
Feb 9, 2004
Sold by
Lesicko Kila S
Bought by
Lesicko Dan M
Create a Home Valuation Report for This Property
The Home Valuation Report is an in-depth analysis detailing your home's value as well as a comparison with similar homes in the area
Home Values in the Area
Average Home Value in this Area
Purchase History
| Date | Buyer | Sale Price | Title Company |
|---|---|---|---|
| Smith Rhett C | -- | Vantage Point Title | |
| Smith Rhett C | $92,000 | Abstracts & Titles | |
| Towner Stan | $32,000 | Abstracts & Titles Inc | |
| Lesicko Dan M | -- | -- |
Source: Public Records
Mortgage History
| Date | Status | Borrower | Loan Amount |
|---|---|---|---|
| Open | Smith Rhett C | $113,960 | |
| Previous Owner | Smith Rhett C | $90,233 |
Source: Public Records
Tax History Compared to Growth
Tax History
| Year | Tax Paid | Tax Assessment Tax Assessment Total Assessment is a certain percentage of the fair market value that is determined by local assessors to be the total taxable value of land and additions on the property. | Land | Improvement |
|---|---|---|---|---|
| 2024 | $3,326 | $38,770 | $5,740 | $33,030 |
| 2023 | $3,326 | $36,140 | $5,350 | $30,790 |
| 2022 | $3,155 | $33,360 | $4,940 | $28,420 |
| 2021 | $2,351 | $31,090 | $4,600 | $26,490 |
| 2020 | $2,833 | $29,940 | $4,430 | $25,510 |
| 2019 | $2,732 | $29,050 | $4,300 | $24,750 |
| 2018 | $1,683 | $23,110 | $4,090 | $19,020 |
| 2017 | $1,544 | $22,560 | $3,990 | $18,570 |
| 2016 | $1,024 | $10,780 | $3,990 | $6,790 |
| 2015 | $2,131 | $10,670 | $3,950 | $6,720 |
| 2014 | $2,131 | $23,070 | $3,950 | $19,120 |
| 2013 | $2,131 | $23,410 | $4,010 | $19,400 |
Source: Public Records
Map
Nearby Homes