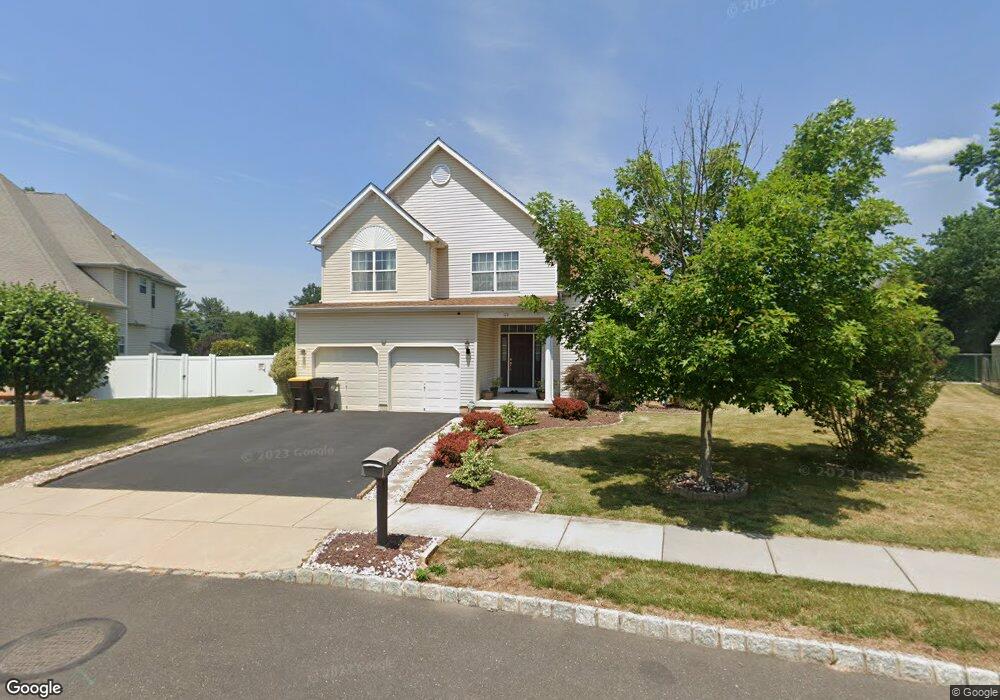
112 Casey Ln Bensalem, PA 19020
Estimated Value: $599,030 - $734,000
4
Beds
3
Baths
2,509
Sq Ft
$269/Sq Ft
Est. Value
About This Home
This home is located at 112 Casey Ln, Bensalem, PA 19020 and is currently estimated at $675,258, approximately $269 per square foot. 112 Casey Ln is a home located in Bucks County with nearby schools including St. Anselm Elementary School, St. Ephrem School, and Holy Ghost Preparatory School.
Ownership History
Date
Name
Owned For
Owner Type
Purchase Details
Closed on
Dec 7, 2009
Sold by
Casey Lane Associates Lp
Bought by
Shah Tejas C and Shah Vandana T
Current Estimated Value
Home Financials for this Owner
Home Financials are based on the most recent Mortgage that was taken out on this home.
Original Mortgage
$318,400
Outstanding Balance
$208,742
Interest Rate
5%
Mortgage Type
New Conventional
Estimated Equity
$466,516
Purchase Details
Closed on
Mar 4, 2008
Sold by
Casey Lane Associates Lp
Bought by
Patel Rameshbhai and Patel Gita
Purchase Details
Closed on
Sep 20, 2005
Sold by
Brd Enterprises Llc
Bought by
Casey Lane Associates Lp
Home Financials for this Owner
Home Financials are based on the most recent Mortgage that was taken out on this home.
Original Mortgage
$5,049,131
Interest Rate
5.84%
Mortgage Type
Purchase Money Mortgage
Purchase Details
Closed on
Jan 14, 2005
Sold by
Branka Michael J and Branka Susan
Bought by
Rrd Enterprises Llc
Create a Home Valuation Report for This Property
The Home Valuation Report is an in-depth analysis detailing your home's value as well as a comparison with similar homes in the area
Home Values in the Area
Average Home Value in this Area
Purchase History
| Date | Buyer | Sale Price | Title Company |
|---|---|---|---|
| Shah Tejas C | $398,000 | First American Title Ins Co | |
| Patel Rameshbhai | $399,900 | None Available | |
| Casey Lane Associates Lp | $2,750,000 | None Available | |
| Rrd Enterprises Llc | $500,000 | -- |
Source: Public Records
Mortgage History
| Date | Status | Borrower | Loan Amount |
|---|---|---|---|
| Open | Shah Tejas C | $318,400 | |
| Previous Owner | Casey Lane Associates Lp | $5,049,131 |
Source: Public Records
Tax History Compared to Growth
Tax History
| Year | Tax Paid | Tax Assessment Tax Assessment Total Assessment is a certain percentage of the fair market value that is determined by local assessors to be the total taxable value of land and additions on the property. | Land | Improvement |
|---|---|---|---|---|
| 2025 | $8,066 | $36,950 | $5,300 | $31,650 |
| 2024 | $8,066 | $36,950 | $5,300 | $31,650 |
| 2023 | $7,839 | $36,950 | $5,300 | $31,650 |
| 2022 | $7,793 | $36,950 | $5,300 | $31,650 |
| 2021 | $7,793 | $36,950 | $5,300 | $31,650 |
| 2020 | $7,715 | $36,950 | $5,300 | $31,650 |
| 2019 | $7,542 | $36,950 | $5,300 | $31,650 |
| 2018 | $7,368 | $36,950 | $5,300 | $31,650 |
| 2017 | $7,321 | $36,950 | $5,300 | $31,650 |
| 2016 | $7,321 | $36,950 | $5,300 | $31,650 |
| 2015 | -- | $36,950 | $5,300 | $31,650 |
| 2014 | -- | $36,950 | $5,300 | $31,650 |
Source: Public Records
Map
Nearby Homes
- 1421 Alexander Way
- 1393 Argyle Way
- 1398 Arundel Way
- 1368 Arundel Way
- 1100 Wayland Ave
- 1446 Gibson Rd
- 1446 Gibson Rd Unit D50
- 1839 Byberry Rd
- 446 N Mount Vernon Cir Unit 446
- 423 N Mount Vernon Cir Unit 423
- 1881 Byberry Rd
- 953 Farley Rd
- 1852 Gibson Rd Unit 58
- 389 Rutgers Ct Unit 389
- 4122 Mechanicsville Rd
- 1302 Gibson Rd Unit 106
- 1302 Gibson Rd
- 396 Rutgers Ct Unit 396
- 5102 Lighthouse Ln
- 1639 Briarwood Dr Unit 145