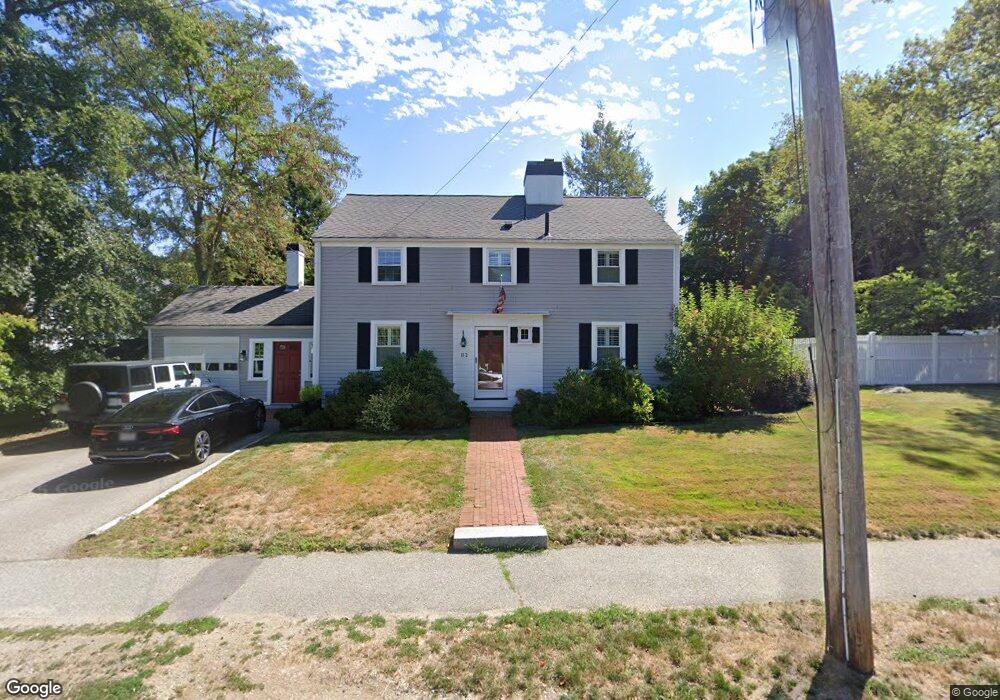
112 Central St Hingham, MA 02043
Estimated Value: $1,211,946 - $1,498,000
4
Beds
2
Baths
1,632
Sq Ft
$838/Sq Ft
Est. Value
About This Home
This home is located at 112 Central St, Hingham, MA 02043 and is currently estimated at $1,368,237, approximately $838 per square foot. 112 Central St is a home located in Plymouth County with nearby schools including William L. Foster Elementary School, Hingham Middle School, and Hingham High School.
Ownership History
Date
Name
Owned For
Owner Type
Purchase Details
Closed on
Mar 28, 2013
Sold by
Brasseur Jay F and Yule-Brasseur Shauna S
Bought by
Fallon Dana K
Current Estimated Value
Home Financials for this Owner
Home Financials are based on the most recent Mortgage that was taken out on this home.
Original Mortgage
$494,250
Outstanding Balance
$344,272
Interest Rate
3.56%
Mortgage Type
New Conventional
Estimated Equity
$1,023,965
Purchase Details
Closed on
Jun 15, 2010
Sold by
Myers Stephen V and Myers Katharine C
Bought by
Brasseur Jay F and Yule-Brasseur Shauna S
Home Financials for this Owner
Home Financials are based on the most recent Mortgage that was taken out on this home.
Original Mortgage
$100,000
Interest Rate
5.03%
Purchase Details
Closed on
Apr 1, 2003
Sold by
Oneil John
Bought by
Myers Stephen V and Myers Katharine C
Home Financials for this Owner
Home Financials are based on the most recent Mortgage that was taken out on this home.
Original Mortgage
$416,000
Interest Rate
5.75%
Create a Home Valuation Report for This Property
The Home Valuation Report is an in-depth analysis detailing your home's value as well as a comparison with similar homes in the area
Purchase History
| Date | Buyer | Sale Price | Title Company |
|---|---|---|---|
| Fallon Dana K | $629,250 | -- | |
| Fallon Dana K | $629,250 | -- | |
| Brasseur Jay F | $585,000 | -- | |
| Myers Stephen V | $520,000 | -- |
Source: Public Records
Mortgage History
| Date | Status | Borrower | Loan Amount |
|---|---|---|---|
| Open | Fallon Dana K | $494,250 | |
| Closed | Fallon Dana K | $494,250 | |
| Previous Owner | Myers Stephen V | $100,000 | |
| Previous Owner | Brasseur Jay F | $275,000 | |
| Previous Owner | Myers Stephen V | $416,000 |
Source: Public Records
Tax History
| Year | Tax Paid | Tax Assessment Tax Assessment Total Assessment is a certain percentage of the fair market value that is determined by local assessors to be the total taxable value of land and additions on the property. | Land | Improvement |
|---|---|---|---|---|
| 2025 | $10,653 | $996,500 | $555,800 | $440,700 |
| 2024 | $10,391 | $957,700 | $555,800 | $401,900 |
| 2023 | $9,211 | $921,100 | $555,800 | $365,300 |
| 2022 | $8,724 | $754,700 | $463,200 | $291,500 |
| 2021 | $8,756 | $742,000 | $482,500 | $259,500 |
| 2020 | $6,656 | $742,000 | $482,500 | $259,500 |
| 2019 | $8,561 | $724,900 | $482,500 | $242,400 |
| 2018 | $8,532 | $724,900 | $482,500 | $242,400 |
| 2017 | $8,107 | $661,800 | $468,300 | $193,500 |
| 2016 | $7,989 | $639,600 | $446,100 | $193,500 |
| 2015 | $7,749 | $618,400 | $424,900 | $193,500 |
Source: Public Records
Map
Nearby Homes
Your Personal Tour Guide
Ask me questions while you tour the home.