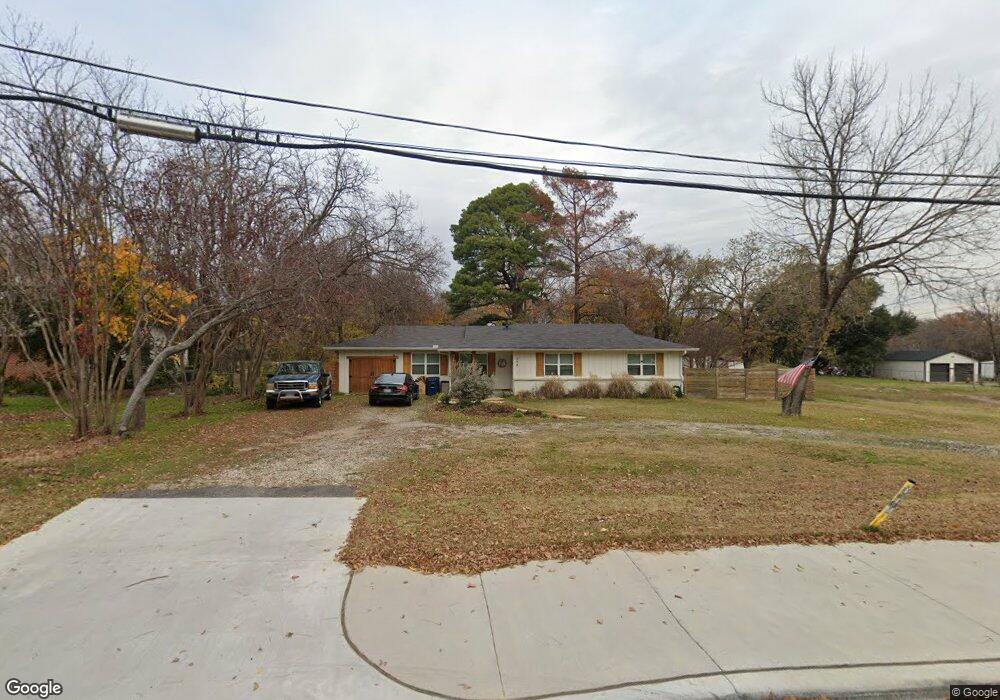
112 Cheek Sparger Rd Colleyville, TX 76034
Estimated Value: $438,000 - $552,000
3
Beds
2
Baths
1,310
Sq Ft
$378/Sq Ft
Est. Value
About This Home
This home is located at 112 Cheek Sparger Rd, Colleyville, TX 76034 and is currently estimated at $495,669, approximately $378 per square foot. 112 Cheek Sparger Rd is a home located in Tarrant County with nearby schools including Bransford Elementary School, Colleyville Middle School, and Grapevine High School.
Ownership History
Date
Name
Owned For
Owner Type
Purchase Details
Closed on
May 20, 2021
Sold by
Robinette Anthony
Bought by
Evans Toni Lynn and Evans Christopher W
Current Estimated Value
Home Financials for this Owner
Home Financials are based on the most recent Mortgage that was taken out on this home.
Original Mortgage
$290,400
Outstanding Balance
$262,763
Interest Rate
3%
Mortgage Type
New Conventional
Estimated Equity
$232,906
Purchase Details
Closed on
Feb 23, 2018
Sold by
Chatsworth Enterprises Llc
Bought by
Robinette Anthony
Home Financials for this Owner
Home Financials are based on the most recent Mortgage that was taken out on this home.
Original Mortgage
$216,015
Interest Rate
4.62%
Mortgage Type
FHA
Purchase Details
Closed on
May 29, 2012
Sold by
Chatswolfe Enterprises Llc
Bought by
Chatsworth Enterprises Llc
Purchase Details
Closed on
Jul 3, 2008
Sold by
Peek Billie Joe and Peek Betty Jane
Bought by
Chatswolfe Enterprise Llc
Create a Home Valuation Report for This Property
The Home Valuation Report is an in-depth analysis detailing your home's value as well as a comparison with similar homes in the area
Home Values in the Area
Average Home Value in this Area
Purchase History
| Date | Buyer | Sale Price | Title Company |
|---|---|---|---|
| Evans Toni Lynn | -- | Superior Abstract & Ttl Llc | |
| Robinette Anthony | -- | None Available | |
| Chatsworth Enterprises Llc | -- | Lawyers Title | |
| Chatswolfe Enterprise Llc | -- | None Available |
Source: Public Records
Mortgage History
| Date | Status | Borrower | Loan Amount |
|---|---|---|---|
| Open | Evans Toni Lynn | $290,400 | |
| Previous Owner | Robinette Anthony | $216,015 |
Source: Public Records
Tax History Compared to Growth
Tax History
| Year | Tax Paid | Tax Assessment Tax Assessment Total Assessment is a certain percentage of the fair market value that is determined by local assessors to be the total taxable value of land and additions on the property. | Land | Improvement |
|---|---|---|---|---|
| 2025 | $1,750 | $456,091 | $278,305 | $177,786 |
| 2024 | $1,750 | $456,091 | $278,305 | $177,786 |
| 2023 | $6,594 | $390,878 | $278,305 | $112,573 |
| 2022 | $7,052 | $357,037 | $278,305 | $78,732 |
| 2021 | $6,418 | $292,233 | $206,610 | $85,623 |
| 2020 | $6,664 | $299,905 | $206,610 | $93,295 |
| 2019 | $6,788 | $293,604 | $206,610 | $86,994 |
| 2018 | $1,229 | $206,788 | $206,610 | $178 |
| 2017 | $4,885 | $206,788 | $206,610 | $178 |
| 2016 | $6,075 | $257,167 | $203,610 | $53,557 |
| 2015 | $2,271 | $98,000 | $35,000 | $63,000 |
| 2014 | $2,271 | $98,000 | $35,000 | $63,000 |
Source: Public Records
Map
Nearby Homes
- 3713 Brentwood Ct
- 2732 Woodbridge Dr
- 405 Woodbriar Ct
- 2620 Brookridge Dr
- 312 Bremen Dr
- 305 Warbler Dr
- 405 Bremen Dr
- 628 Huntwich Dr
- 4600 Bransford Rd
- 2844 Hurstview Dr
- 320 Blue Quail Ct
- 3605 Spring Valley Dr
- 909 Brestol Ct W
- 2809 Sandstone Dr
- 404 Heather Ln
- 2804 Ridgewood Dr
- 2829 Sandstone Dr
- 2668 Bent Tree Dr
- 2244 Hurstview Dr
- 3609 Wayne Ct
- 116 Cheek Sparger Rd
- 108 Cheek Sparger Rd
- 120 Cheek Sparger Rd
- 104 Cheek Sparger Rd
- 102 Cheek-Sparger Rd
- 119 Cheek Sparger Rd
- 124 Cheek Sparger Rd
- 124 Cheek-Sparger Rd
- 100 Cheek Sparger Rd
- 100 Cheek Sparger Rd
- 100 Cheek Sparger Rd Unit 102
- 123 Cheek Sparger Rd
- 200 Cheek Sparger Rd
- 128 Cheek Sparger Rd
- 4007 Colleyville Blvd
- 124 Felps Ct
- 127 Cheek Sparger Rd
- 121 Acuff Ln
- 100 Greenbriar Ln
- 123 Acuff Ln