Estimated Value: $132,727 - $209,000
3
Beds
1
Bath
1,365
Sq Ft
$122/Sq Ft
Est. Value
About This Home
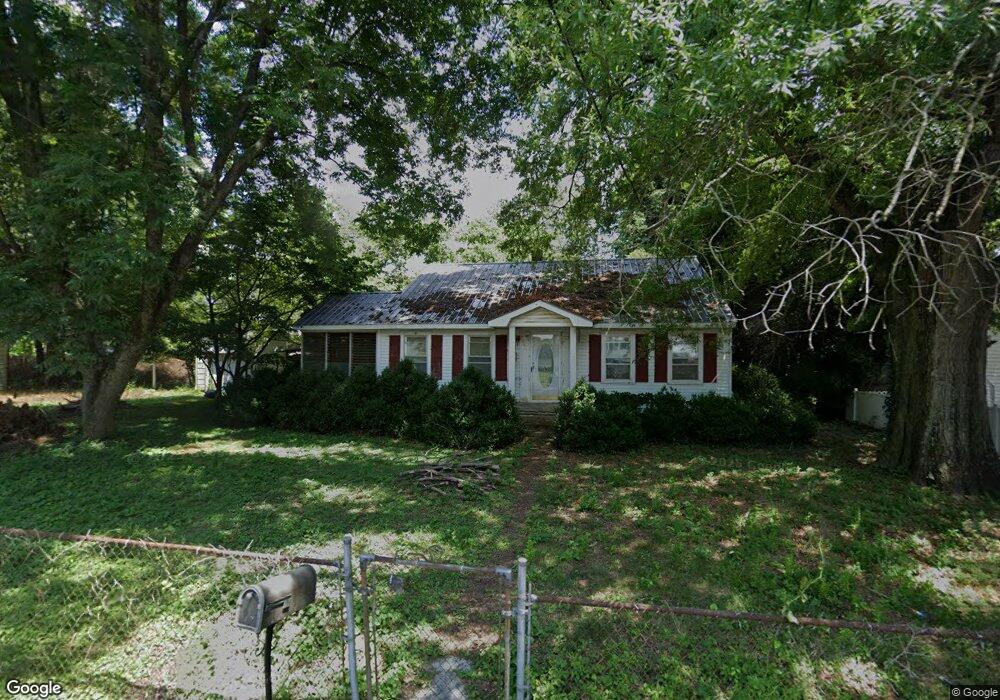
This home is located at 112 Cherry St, Trion, GA 30753 and is currently estimated at $166,682, approximately $122 per square foot. 112 Cherry St is a home located in Chattooga County with nearby schools including Chattooga High School.
Ownership History
Date
Name
Owned For
Owner Type
Purchase Details
Closed on
Sep 16, 2010
Sold by
Federal National Mortgage Association
Bought by
Palmour Kim
Current Estimated Value
Purchase Details
Closed on
Mar 2, 2010
Sold by
Nationstar Mtg Llc
Bought by
Federal National Mtg Associati
Purchase Details
Closed on
Aug 8, 2006
Sold by
Not Provided
Bought by
Palmour Kim and Palmour Kay Brad
Home Financials for this Owner
Home Financials are based on the most recent Mortgage that was taken out on this home.
Original Mortgage
$60,000
Interest Rate
6.68%
Mortgage Type
New Conventional
Create a Home Valuation Report for This Property
The Home Valuation Report is an in-depth analysis detailing your home's value as well as a comparison with similar homes in the area
Home Values in the Area
Average Home Value in this Area
Purchase History
| Date | Buyer | Sale Price | Title Company |
|---|---|---|---|
| Palmour Kim | $32,500 | -- | |
| Palmour Kim | $32,500 | -- | |
| Federal National Mtg Associati | $75,703 | -- | |
| Nationstar Mtg Llc | $75,703 | -- | |
| Federal National Mtg Associati | $75,703 | -- | |
| Nationstar Mtg Llc | $75,703 | -- | |
| Palmour Kim | -- | -- |
Source: Public Records
Mortgage History
| Date | Status | Borrower | Loan Amount |
|---|---|---|---|
| Previous Owner | Palmour Kim | $60,000 |
Source: Public Records
Tax History
| Year | Tax Paid | Tax Assessment Tax Assessment Total Assessment is a certain percentage of the fair market value that is determined by local assessors to be the total taxable value of land and additions on the property. | Land | Improvement |
|---|---|---|---|---|
| 2025 | $699 | $49,264 | $1,760 | $47,504 |
| 2024 | $472 | $25,447 | $4,095 | $21,352 |
| 2023 | $574 | $25,447 | $4,095 | $21,352 |
| 2022 | $530 | $25,447 | $1,833 | $23,614 |
| 2021 | $608 | $22,849 | $1,833 | $21,016 |
| 2020 | $639 | $22,849 | $1,833 | $21,016 |
| 2019 | $688 | $23,972 | $1,833 | $22,139 |
| 2018 | $654 | $23,714 | $1,824 | $21,890 |
| 2017 | $689 | $23,714 | $1,824 | $21,890 |
| 2016 | $647 | $23,714 | $1,824 | $21,890 |
| 2015 | -- | $25,587 | $1,824 | $23,763 |
| 2014 | -- | $25,292 | $1,529 | $23,763 |
| 2013 | -- | $25,292 | $1,528 | $23,763 |
Source: Public Records
Map
Nearby Homes
- 97 S Pine St
- 220 Harrell St
- 96 S Second St
- 206 Pine St
- 1670 Back Penn Rd
- 1661 Back Penn Rd
- 0 Lake View Cir Unit 10426229
- 0 Highway 27 Unit 10692665
- 0 Highway 27 Unit 7719925
- 1241 Back Penn Rd
- 161 Elm St
- 51 Oak St
- 78 Oak St
- 148 Simmons St
- 120 Knox St
- 69 Myers Ave
- 157 Park Ave
- 743 Pine St
- 106 Melba Dr
- 64 Hartline Hill Rd
Your Personal Tour Guide
Ask me questions while you tour the home.