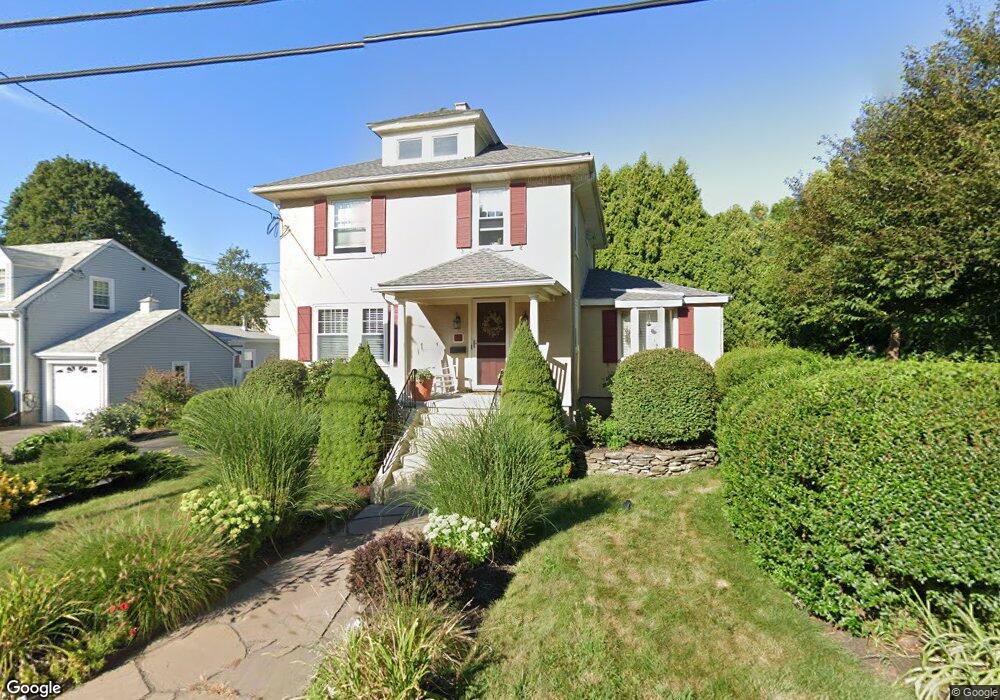
112 Clapp St Milton, MA 02186
Milton Center NeighborhoodEstimated Value: $918,000 - $1,024,000
3
Beds
2
Baths
1,735
Sq Ft
$559/Sq Ft
Est. Value
About This Home
This home is located at 112 Clapp St, Milton, MA 02186 and is currently estimated at $969,713, approximately $558 per square foot. 112 Clapp St is a home located in Norfolk County with nearby schools including Milton High School, St. Mary of the Hills School, and Milton Academy.
Ownership History
Date
Name
Owned For
Owner Type
Purchase Details
Closed on
Oct 15, 2020
Sold by
Hayward Edward G and Hayward Sheila D
Bought by
Hayward Rt
Current Estimated Value
Purchase Details
Closed on
Aug 29, 1995
Sold by
Hedge Hemant K
Bought by
Hayward Edward G and Hayward Sheila D
Create a Home Valuation Report for This Property
The Home Valuation Report is an in-depth analysis detailing your home's value as well as a comparison with similar homes in the area
Home Values in the Area
Average Home Value in this Area
Purchase History
| Date | Buyer | Sale Price | Title Company |
|---|---|---|---|
| Hayward Rt | -- | None Available | |
| Hayward Edward G | $172,000 | -- |
Source: Public Records
Mortgage History
| Date | Status | Borrower | Loan Amount |
|---|---|---|---|
| Previous Owner | Hayward Edward G | $100,000 | |
| Previous Owner | Hayward Edward G | $222,550 | |
| Previous Owner | Hayward Edward G | $15,000 |
Source: Public Records
Tax History
| Year | Tax Paid | Tax Assessment Tax Assessment Total Assessment is a certain percentage of the fair market value that is determined by local assessors to be the total taxable value of land and additions on the property. | Land | Improvement |
|---|---|---|---|---|
| 2025 | $9,306 | $839,100 | $422,300 | $416,800 |
| 2024 | $9,032 | $827,100 | $402,100 | $425,000 |
| 2023 | $8,752 | $767,700 | $383,100 | $384,600 |
| 2022 | $8,508 | $682,300 | $383,100 | $299,200 |
| 2021 | $8,180 | $623,000 | $338,100 | $284,900 |
| 2020 | $7,646 | $582,800 | $302,400 | $280,400 |
| 2019 | $7,457 | $565,800 | $293,600 | $272,200 |
| 2018 | $7,061 | $511,300 | $245,300 | $266,000 |
| 2017 | $6,606 | $487,200 | $233,700 | $253,500 |
| 2016 | $6,313 | $467,600 | $219,100 | $248,500 |
| 2015 | $6,195 | $444,400 | $201,500 | $242,900 |
Source: Public Records
Map
Nearby Homes
- 424 Brook Rd
- 46 Audubon Rd
- 484 Brook Rd
- 137 Thacher St Unit 137
- 259 Central Ave
- 7 Parkway Crescent
- 16 West St
- 260 Canton Ave
- 214 Brook Rd
- 18 Fairfax Rd
- 168 Brook Rd
- 485 Blue Hills Pkwy Unit 10
- 485 Blue Hills Pkwy Unit 12
- 485 Blue Hills Pkwy Unit 33
- 485 Blue Hills Pkwy Unit 13
- 485 Blue Hills Pkwy Unit 2
- 485 Blue Hills Pkwy Unit 23
- 485 Blue Hills Pkwy Unit 49
- 485 Blue Hills Pkwy Unit 6
- 29/31 Belvoir Rd
Your Personal Tour Guide
Ask me questions while you tour the home.