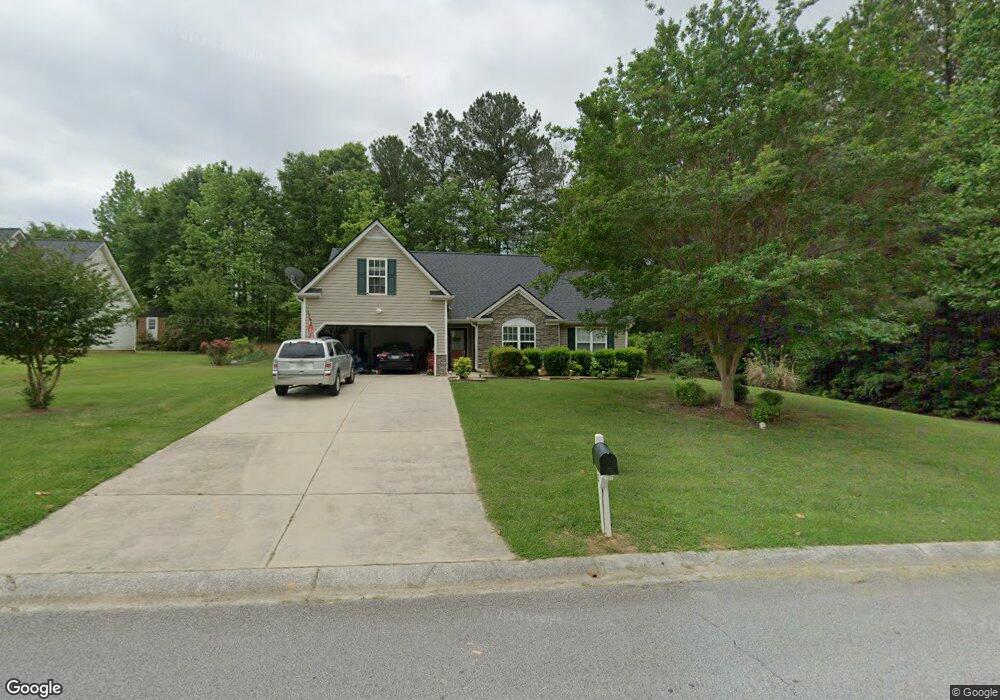
112 Clarion Dr Carrollton, GA 30116
Estimated Value: $263,083 - $298,000
3
Beds
2
Baths
1,765
Sq Ft
$160/Sq Ft
Est. Value
About This Home
This home is located at 112 Clarion Dr, Carrollton, GA 30116 and is currently estimated at $281,771, approximately $159 per square foot. 112 Clarion Dr is a home located in Carroll County with nearby schools including Carrollton Elementary School, Carrollton Upper Elementary School, and Carrollton Middle School.
Ownership History
Date
Name
Owned For
Owner Type
Purchase Details
Closed on
Jul 28, 2021
Sold by
Howell Randy Scott
Bought by
Dupriest John W
Current Estimated Value
Purchase Details
Closed on
Jun 29, 2021
Sold by
Executor Howell Randy Scott
Bought by
Howell Richard Curtis and Howell Randy Scott
Purchase Details
Closed on
Oct 15, 2004
Sold by
Borgia Chelsea N and Barfield Ca
Bought by
Pate Shirley M
Purchase Details
Closed on
Aug 6, 2003
Sold by
Blackmon Vinson J
Bought by
Borgia Chelsea N and Barfield Carolyn
Purchase Details
Closed on
Apr 22, 2003
Sold by
Armor Properties Inc
Bought by
Blackmon Vinson J
Purchase Details
Closed on
Apr 18, 2003
Sold by
Morris William M
Bought by
Armor Properties Inc
Purchase Details
Closed on
Aug 27, 2002
Sold by
Armor Properties Inc
Bought by
Morris William M
Purchase Details
Closed on
Jul 31, 2002
Sold by
Armor Properties Inc
Bought by
Armor Properties Inc
Purchase Details
Closed on
May 24, 2002
Bought by
Armor Properties Inc
Create a Home Valuation Report for This Property
The Home Valuation Report is an in-depth analysis detailing your home's value as well as a comparison with similar homes in the area
Home Values in the Area
Average Home Value in this Area
Purchase History
| Date | Buyer | Sale Price | Title Company |
|---|---|---|---|
| Dupriest John W | $172,000 | -- | |
| Howell Richard Curtis | -- | -- | |
| Pate Shirley M | $126,000 | -- | |
| Borgia Chelsea N | $129,000 | -- | |
| Blackmon Vinson J | $26,500 | -- | |
| Armor Properties Inc | $26,500 | -- | |
| Morris William M | -- | -- | |
| Armor Properties Inc | -- | -- | |
| Armor Properties Inc | -- | -- |
Source: Public Records
Tax History Compared to Growth
Tax History
| Year | Tax Paid | Tax Assessment Tax Assessment Total Assessment is a certain percentage of the fair market value that is determined by local assessors to be the total taxable value of land and additions on the property. | Land | Improvement |
|---|---|---|---|---|
| 2024 | $817 | $109,466 | $8,000 | $101,466 |
| 2023 | $801 | $100,200 | $8,000 | $92,200 |
| 2022 | $668 | $79,958 | $6,000 | $73,958 |
| 2021 | $500 | $69,299 | $6,000 | $63,299 |
| 2020 | $472 | $62,643 | $6,000 | $56,643 |
| 2019 | $459 | $57,299 | $6,000 | $51,299 |
| 2018 | $421 | $45,871 | $6,000 | $39,871 |
| 2017 | $426 | $45,871 | $6,000 | $39,871 |
| 2016 | $428 | $45,871 | $6,000 | $39,871 |
| 2015 | $412 | $41,430 | $6,000 | $35,430 |
| 2014 | $310 | $32,573 | $6,000 | $26,573 |
Source: Public Records
Map
Nearby Homes
- 5 Knob Dr
- 680 Horsley Mill Rd
- 690 Horsley Mill Rd
- 103 Hilo Ct
- TRACT 8 Horsley Mill Rd
- TRACT 9 Horsley Mill Rd
- 204 Pinehurst Way
- 240 Knob Dr
- The Rosewood Plan at Oak Mountain View
- The Northview Plan at Oak Mountain View
- The Newburgh Plan at Oak Mountain View
- The Brookdale Plan at Oak Mountain View
- The Donovan Plan at Oak Mountain View
- The Rochester Plan at Oak Mountain View
- The Wendell Plan at Oak Mountain View
- The Carrollton Plan at Oak Mountain View
- 205 Turnberry Cir
- 214 Asher Dr
- 971 Horsley Mill Rd
- 116 Camilla Dr
- 114 Clarion Dr
- 585 Horsley Mill Rd
- 116 Clarion Dr
- 113 Clarion Dr Unit 4
- 113 Clarion Dr
- 110 Beckett Ct
- 111 Clarion Dr
- 115 Clarion Dr
- 109 Clarion Dr
- 118 Clarion Dr
- 108 Beckett Ct
- 108 Clarion Dr
- 117 Clarion Dr
- 112 Beckett Ct
- 105 Clarion Dr
- 119 Clarion Dr
- 116 Beckett Ct
- 106 Clarion Dr
- 106 Clarion Dr
- 106 Clarion Dr