--
Bed
--
Bath
2,365
Sq Ft
6,970
Sq Ft Lot
About This Home
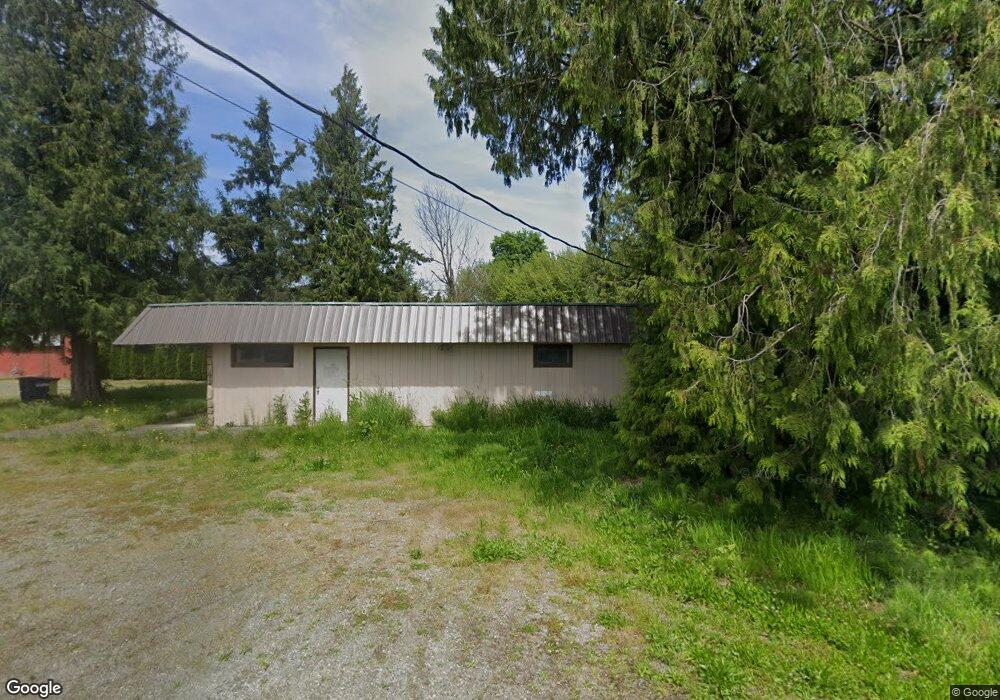
This home is located at 112 Columbia St, Sumas, WA 98295. 112 Columbia St is a home located in Whatcom County with nearby schools including Sumas Elementary School, Nooksack Elementary School, and Everson Elementary School.
Ownership History
Date
Name
Owned For
Owner Type
Purchase Details
Closed on
Feb 10, 2022
Sold by
Smc Holdings Llc
Bought by
Rameshwar Mahadev Hindu Temple
Home Financials for this Owner
Home Financials are based on the most recent Mortgage that was taken out on this home.
Original Mortgage
$54,000
Outstanding Balance
$50,143
Interest Rate
3.55%
Mortgage Type
New Conventional
Purchase Details
Closed on
Oct 22, 2010
Sold by
Kyn Llc
Bought by
Smc Holdings Llc
Home Financials for this Owner
Home Financials are based on the most recent Mortgage that was taken out on this home.
Original Mortgage
$108,767
Interest Rate
4.27%
Mortgage Type
Commercial
Purchase Details
Closed on
Jan 6, 2005
Sold by
Okeefe Johnson James B and Okeefe Johnson Kathryn
Bought by
Kyn Llc
Home Financials for this Owner
Home Financials are based on the most recent Mortgage that was taken out on this home.
Original Mortgage
$125,080
Interest Rate
5.69%
Mortgage Type
Commercial
Create a Home Valuation Report for This Property
The Home Valuation Report is an in-depth analysis detailing your home's value as well as a comparison with similar homes in the area
Home Values in the Area
Average Home Value in this Area
Purchase History
| Date | Buyer | Sale Price | Title Company |
|---|---|---|---|
| Rameshwar Mahadev Hindu Temple | $75,000 | Whatcom Land Title | |
| Smc Holdings Llc | $181,948 | Chicago Title Insurance | |
| Kyn Llc | $155,000 | Stewart Title Company |
Source: Public Records
Mortgage History
| Date | Status | Borrower | Loan Amount |
|---|---|---|---|
| Open | Rameshwar Mahadev Hindu Temple | $54,000 | |
| Previous Owner | Smc Holdings Llc | $108,767 | |
| Previous Owner | Kyn Llc | $125,080 |
Source: Public Records
Tax History Compared to Growth
Tax History
| Year | Tax Paid | Tax Assessment Tax Assessment Total Assessment is a certain percentage of the fair market value that is determined by local assessors to be the total taxable value of land and additions on the property. | Land | Improvement |
|---|---|---|---|---|
| 2024 | $1,352 | $90,306 | $25,602 | $64,704 |
| 2023 | $1,352 | $136,399 | $20,242 | $116,157 |
| 2022 | $1,590 | $136,399 | $20,242 | $116,157 |
| 2021 | $1,844 | $136,399 | $20,242 | $116,157 |
| 2020 | $1,768 | $136,399 | $20,242 | $116,157 |
| 2019 | $1,562 | $136,399 | $20,242 | $116,157 |
| 2018 | $2,055 | $136,399 | $20,242 | $116,157 |
| 2017 | $1,979 | $137,594 | $18,926 | $118,668 |
| 2016 | $1,961 | $137,594 | $18,926 | $118,668 |
| 2015 | $1,779 | $137,594 | $18,926 | $118,668 |
| 2014 | -- | $134,500 | $18,500 | $116,000 |
| 2013 | -- | $134,500 | $18,500 | $116,000 |
Source: Public Records
Map
Nearby Homes
- 124 Columbia St
- 310 Second St
- 136 First St
- 242 Morton St
- 1005 Johnson St
- 217 Noble St
- 230 Gough St
- 555 Morton St
- 4355 Jones Rd
- 4135 Kamphouse Dr
- 5326 Reese Hill Rd
- 5363 Reese Hill Rd
- 5376 Reese Hill Rd
- 48 XX Reese Hill Rd
- 8381 N Telegraph Rd
- 9919 Holmquist Rd
- 5615 S Pass Rd
- 6801 S Pass Rd
- 3630 Sorenson Rd
- 201 Brentwood Dr