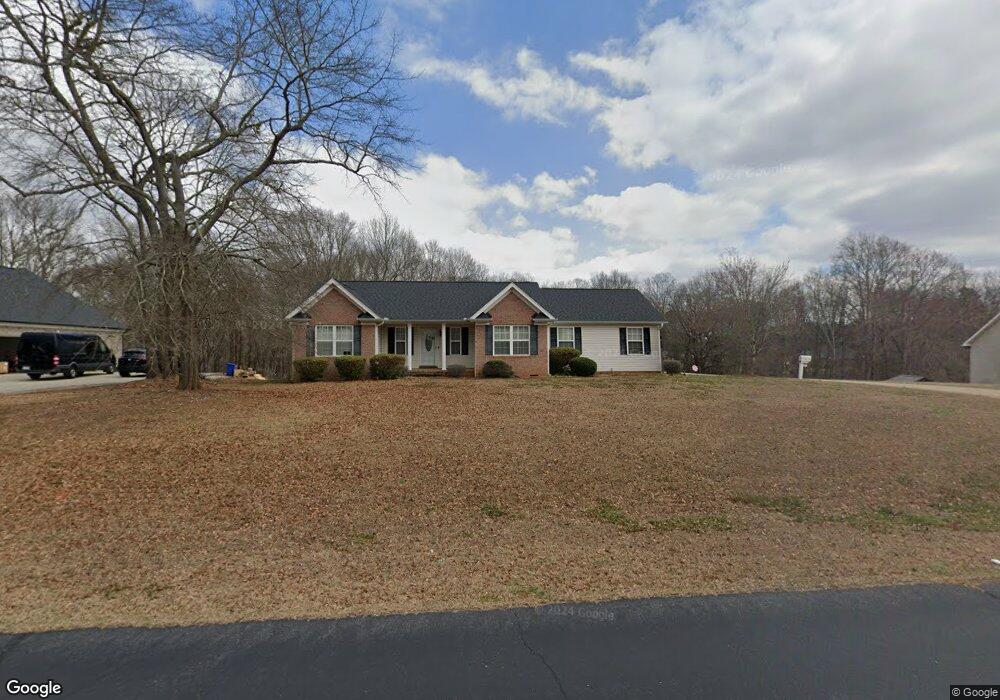
112 Commodore Dr Duncan, SC 29334
Estimated Value: $307,000 - $362,000
3
Beds
2
Baths
1,710
Sq Ft
$192/Sq Ft
Est. Value
About This Home
This home is located at 112 Commodore Dr, Duncan, SC 29334 and is currently estimated at $328,908, approximately $192 per square foot. 112 Commodore Dr is a home located in Spartanburg County with nearby schools including Florence Chapel Middle School, Byrnes Freshman Academy, and James F. Byrnes High School.
Ownership History
Date
Name
Owned For
Owner Type
Purchase Details
Closed on
Aug 29, 2017
Sold by
Sims Leroy
Bought by
Sims Leroy and Sims Linda G
Current Estimated Value
Home Financials for this Owner
Home Financials are based on the most recent Mortgage that was taken out on this home.
Original Mortgage
$155,677
Outstanding Balance
$129,265
Interest Rate
3.78%
Mortgage Type
FHA
Estimated Equity
$199,644
Purchase Details
Closed on
Jan 19, 2005
Sold by
Matson Roger J
Bought by
Sims Leroy
Home Financials for this Owner
Home Financials are based on the most recent Mortgage that was taken out on this home.
Original Mortgage
$116,550
Interest Rate
5.66%
Mortgage Type
New Conventional
Purchase Details
Closed on
Dec 15, 2003
Sold by
Forrester Terry Kenneth and Forrester Terry K
Bought by
Matson Roger J
Purchase Details
Closed on
Jun 2, 2003
Sold by
Forrester Brian Thomas and Forrester Brian T
Bought by
Forrester Terry Kenneth and Forrester Terry K
Create a Home Valuation Report for This Property
The Home Valuation Report is an in-depth analysis detailing your home's value as well as a comparison with similar homes in the area
Home Values in the Area
Average Home Value in this Area
Purchase History
| Date | Buyer | Sale Price | Title Company |
|---|---|---|---|
| Sims Leroy | -- | None Available | |
| Sims Leroy | $169,000 | -- | |
| Matson Roger J | $18,500 | -- | |
| Forrester Terry Kenneth | -- | -- |
Source: Public Records
Mortgage History
| Date | Status | Borrower | Loan Amount |
|---|---|---|---|
| Open | Sims Leroy | $155,677 | |
| Closed | Sims Leroy | $116,550 |
Source: Public Records
Tax History
| Year | Tax Paid | Tax Assessment Tax Assessment Total Assessment is a certain percentage of the fair market value that is determined by local assessors to be the total taxable value of land and additions on the property. | Land | Improvement |
|---|---|---|---|---|
| 2025 | $1,009 | $8,271 | $1,188 | $7,083 |
| 2024 | $1,009 | $8,271 | $1,188 | $7,083 |
| 2023 | $1,009 | $8,271 | $1,188 | $7,083 |
| 2022 | $912 | $7,429 | $1,343 | $6,086 |
| 2021 | $912 | $7,429 | $1,343 | $6,086 |
| 2020 | $894 | $7,429 | $1,343 | $6,086 |
| 2019 | $892 | $7,429 | $1,343 | $6,086 |
| 2018 | $844 | $7,429 | $1,343 | $6,086 |
| 2017 | $706 | $6,460 | $1,360 | $5,100 |
| 2016 | $683 | $6,460 | $1,360 | $5,100 |
| 2015 | $651 | $6,460 | $1,360 | $5,100 |
| 2014 | $650 | $6,460 | $1,360 | $5,100 |
Source: Public Records
Map
Nearby Homes
- 128 Clingstone Trail
- 202 Eastberrys Creek Rd
- 32 Apricot Ln
- 1113 Syrah Ln
- 1216 N Pinot Rd
- 1208 N Pinot Rd
- 1301 S Pinot Rd
- 1305 S Pinot Rd
- 1008 Zinfandel Way
- 131 Santa Ana Way
- 150 Santa Ana Way
- 321 Serendipity Ln
- 662 Windward Ln
- 650 Windward Ln
- 576 Serendipity Ln
- 560 Serendipity Ln
- 802 Morning Fog Dr
- 470 Drayton Hall Blvd
- 825 Sweet William Rd
- 829 Sweet William Rd
- 108 Commodore Dr
- 116 Commodore Dr
- 115 Commodore Dr
- 126 Commodore Dr
- 130 Commodore Dr
- 125 Commodore Dr
- 340 White Peach Way
- 336 White Peach Way
- 344 White Peach Way
- 348 White Peach Way
- 332 White Peach Way
- 352 White Peach Way
- 352 White Peach Way
- 328 White Peach Way
- 356 White Peach Way
- 324 White Peach Way
- 146 Commodore Dr
- 360 White Peach Way
- 345 White Peach Way
- 107 Westberrys Creek Rd
Your Personal Tour Guide
Ask me questions while you tour the home.