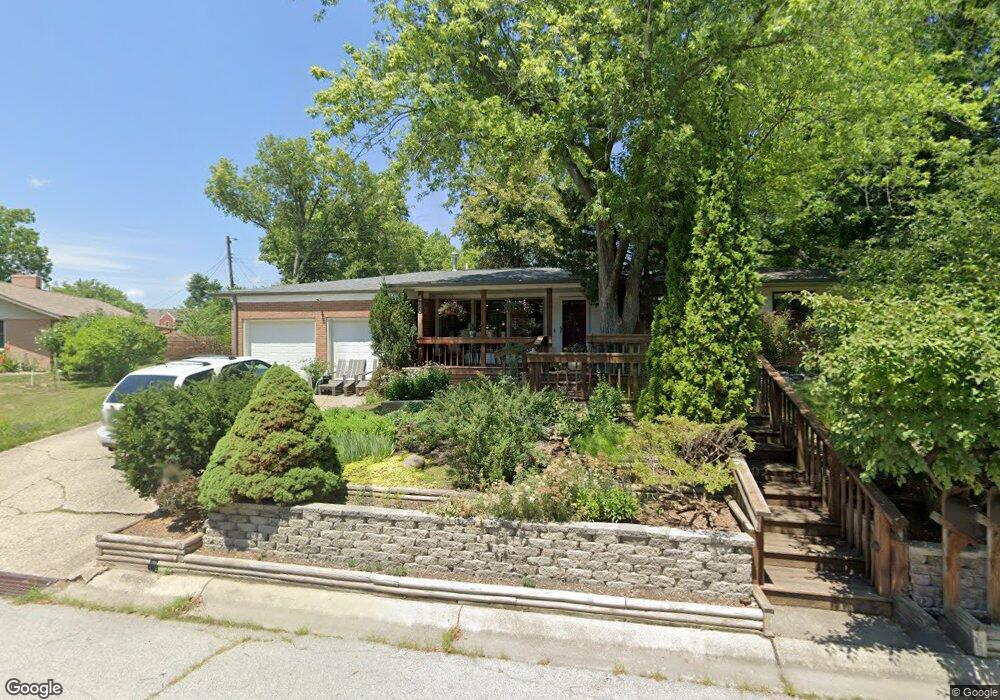
112 Creighton Rd West Lafayette, IN 47906
Estimated Value: $384,000 - $416,000
4
Beds
3
Baths
2,285
Sq Ft
$173/Sq Ft
Est. Value
About This Home
This home is located at 112 Creighton Rd, West Lafayette, IN 47906 and is currently estimated at $396,389, approximately $173 per square foot. 112 Creighton Rd is a home located in Tippecanoe County with nearby schools including West Lafayette Intermediate School, West Lafayette Elementary School, and West Lafayette Junior/Senior High School.
Ownership History
Date
Name
Owned For
Owner Type
Purchase Details
Closed on
Aug 23, 2024
Sold by
Shalabi Ghassan A
Bought by
Shalabi Jill D
Current Estimated Value
Purchase Details
Closed on
Aug 13, 2012
Sold by
Hall Mark C and Hall Hana
Bought by
Shalabi Ghassan A and Shalabi Jill D
Home Financials for this Owner
Home Financials are based on the most recent Mortgage that was taken out on this home.
Original Mortgage
$161,000
Interest Rate
3.6%
Mortgage Type
New Conventional
Purchase Details
Closed on
Aug 2, 2010
Sold by
Hall Mark C and Hall Hana
Bought by
Shalabi Ghassan A and Shalabi Jill D
Purchase Details
Closed on
Apr 30, 2004
Sold by
Thompson G Richard and Thompson Elizabeth Boyd Jordan
Bought by
Hall Mark C and Hall Hana
Home Financials for this Owner
Home Financials are based on the most recent Mortgage that was taken out on this home.
Original Mortgage
$167,675
Interest Rate
5.25%
Mortgage Type
Purchase Money Mortgage
Create a Home Valuation Report for This Property
The Home Valuation Report is an in-depth analysis detailing your home's value as well as a comparison with similar homes in the area
Home Values in the Area
Average Home Value in this Area
Purchase History
| Date | Buyer | Sale Price | Title Company |
|---|---|---|---|
| Shalabi Jill D | -- | None Listed On Document | |
| Shalabi Ghassan A | -- | None Available | |
| Shalabi Ghassan A | -- | None Available | |
| Hall Mark C | -- | -- |
Source: Public Records
Mortgage History
| Date | Status | Borrower | Loan Amount |
|---|---|---|---|
| Previous Owner | Shalabi Ghassan A | $161,000 | |
| Previous Owner | Hall Mark C | $167,675 |
Source: Public Records
Tax History Compared to Growth
Tax History
| Year | Tax Paid | Tax Assessment Tax Assessment Total Assessment is a certain percentage of the fair market value that is determined by local assessors to be the total taxable value of land and additions on the property. | Land | Improvement |
|---|---|---|---|---|
| 2024 | $3,196 | $268,600 | $45,000 | $223,600 |
| 2023 | $2,939 | $252,400 | $45,000 | $207,400 |
| 2022 | $2,738 | $230,300 | $45,000 | $185,300 |
| 2021 | $2,604 | $219,500 | $45,000 | $174,500 |
| 2020 | $2,496 | $210,800 | $45,000 | $165,800 |
| 2019 | $2,401 | $203,200 | $45,000 | $158,200 |
| 2018 | $2,295 | $194,600 | $45,000 | $149,600 |
| 2017 | $2,213 | $188,000 | $45,000 | $143,000 |
| 2016 | $2,003 | $176,100 | $33,100 | $143,000 |
| 2014 | $1,849 | $162,700 | $33,100 | $129,600 |
| 2013 | $1,851 | $161,200 | $33,000 | $128,200 |
Source: Public Records
Map
Nearby Homes
- 500 Carrolton Blvd
- 509 Carrolton Blvd
- 502 Hillcrest Rd
- 1909 Indian Trail Dr
- 701 Carrolton Blvd
- 1912 Indian Trail Dr
- 1411 N Salisbury St
- 618 Northridge Dr
- 2200 Miami Trail
- 1220 Ravinia Rd
- 2212 Sycamore Ln
- 2306 Carmel Dr
- 106 W Navajo St
- 1201 Lindberg Rd
- 237 E Sunset Ln
- 805 N Chauncey Ave
- 631 Kent Ave
- 1868 N River Rd
- 238 Connolly St
- 229 Connolly St
- 108 Creighton Rd
- 112 Wheeler Ln
- 116 Creighton Rd
- 108 Wheeler Ln
- 114 Jordan Ln
- 172 Creighton Rd
- 176 Creighton Rd
- 116 Wheeler Ln
- 180 Creighton Rd
- 100 Wheeler Ln
- 104 Wheeler Ln
- 120 Wheeler Ln
- 168 Creighton Rd
- 100 Jordan Ln
- 112 Jordan Ln
- 104 Jordan Ln
- 124 Wheeler Ln
- 164 Creighton Rd
- 108 Jordan Ln
- 132 Wheeler Ln