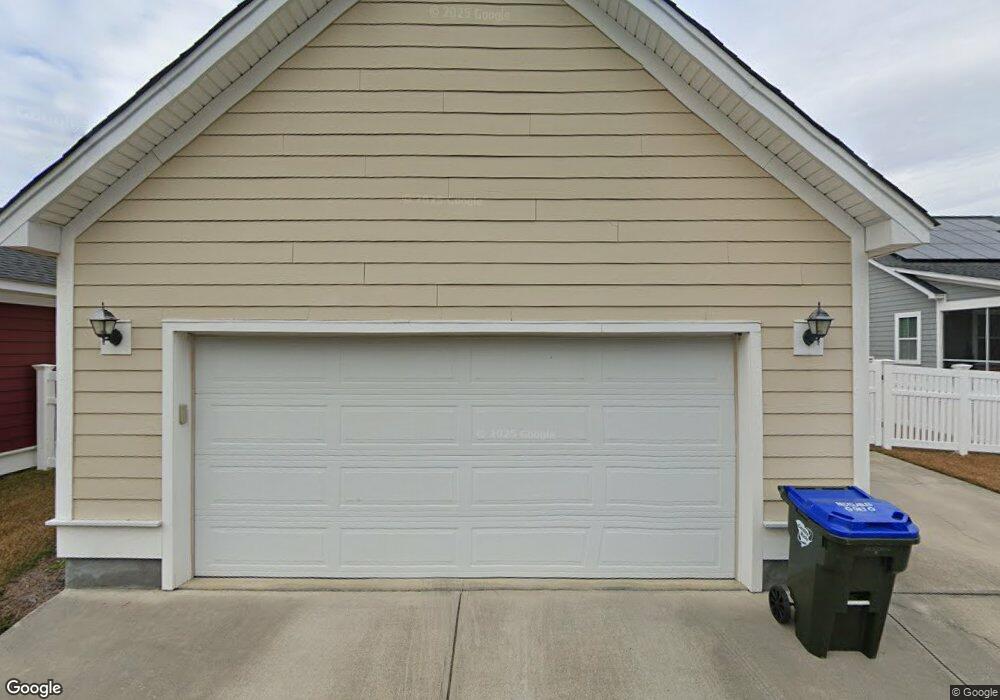
112 Crossandra Ave Summerville, SC 29483
Estimated Value: $352,968 - $365,000
3
Beds
2
Baths
1,540
Sq Ft
$233/Sq Ft
Est. Value
About This Home
This home is located at 112 Crossandra Ave, Summerville, SC 29483 and is currently estimated at $358,992, approximately $233 per square foot. 112 Crossandra Ave is a home located in Dorchester County with nearby schools including Knightsville Elementary School, Charles B. DuBose Middle School, and Summerville High School.
Ownership History
Date
Name
Owned For
Owner Type
Purchase Details
Closed on
Oct 5, 2018
Sold by
Newman James A and Newman Brittaney R
Bought by
Conrad Walter Lee and Conrad Debra J
Current Estimated Value
Home Financials for this Owner
Home Financials are based on the most recent Mortgage that was taken out on this home.
Original Mortgage
$180,800
Outstanding Balance
$157,344
Interest Rate
4.5%
Mortgage Type
New Conventional
Estimated Equity
$201,648
Purchase Details
Closed on
Dec 18, 2014
Sold by
Crescent Homes Sc Llc
Bought by
Newman James A and Newman Brittaney R
Home Financials for this Owner
Home Financials are based on the most recent Mortgage that was taken out on this home.
Original Mortgage
$211,390
Interest Rate
4.09%
Mortgage Type
VA
Purchase Details
Closed on
Aug 22, 2014
Sold by
Redus Sc Coastal Llc
Bought by
Crescent Homes Sc Llc
Create a Home Valuation Report for This Property
The Home Valuation Report is an in-depth analysis detailing your home's value as well as a comparison with similar homes in the area
Home Values in the Area
Average Home Value in this Area
Purchase History
| Date | Buyer | Sale Price | Title Company |
|---|---|---|---|
| Conrad Walter Lee | $226,000 | None Available | |
| Newman James A | $206,941 | -- | |
| Crescent Homes Sc Llc | $34,000 | -- |
Source: Public Records
Mortgage History
| Date | Status | Borrower | Loan Amount |
|---|---|---|---|
| Open | Conrad Walter Lee | $180,800 | |
| Previous Owner | Newman James A | $211,390 |
Source: Public Records
Tax History Compared to Growth
Tax History
| Year | Tax Paid | Tax Assessment Tax Assessment Total Assessment is a certain percentage of the fair market value that is determined by local assessors to be the total taxable value of land and additions on the property. | Land | Improvement |
|---|---|---|---|---|
| 2025 | $2,118 | $13,078 | $4,560 | $8,518 |
| 2024 | $2,118 | $13,078 | $4,560 | $8,518 |
| 2023 | $2,118 | $8,466 | $2,480 | $5,986 |
| 2022 | $1,808 | $9,020 | $2,480 | $6,540 |
| 2021 | $1,776 | $9,020 | $2,480 | $6,540 |
| 2020 | $1,642 | $7,900 | $1,400 | $6,500 |
| 2019 | $1,987 | $7,900 | $1,400 | $6,500 |
| 2018 | $1,777 | $7,900 | $1,400 | $6,500 |
| 2017 | $1,741 | $7,900 | $1,400 | $6,500 |
| 2016 | $1,724 | $7,900 | $1,400 | $6,500 |
| 2015 | $1,726 | $7,900 | $1,400 | $6,500 |
| 2014 | $774 | $35,000 | $0 | $0 |
| 2013 | -- | $2,100 | $0 | $0 |
Source: Public Records
Map
Nearby Homes
- 104 Crossandra Ave
- 111 Foxglove Ave
- 107 Foxglove Ave
- 81 Crossandra Ave
- 117 Blue Bonnet St
- 300 Foxglove Ave
- 72 Crossandra Ave
- 540 O'Leary Cir
- 545 O'Leary Cir
- 546 O'Leary Cir
- 103 Blue Bonnet St
- 307 Amaryllis Ave
- 601 O'Leary Cir
- 552 O'Leary Cir
- 556 O'Leary Cir
- 165 Casein St
- 602 O'Leary Cir
- 606 O'Leary Cir
- 610 O'Leary Cir
- 218 Trillium Ave
- 114 Crossandra Ave
- 110 Crossandra Ave
- 116 Crossandra Ave
- 108 Crossandra Ave
- 118 Crossandra Ave
- 106 Crossandra Ave
- 111 Amaryllis Ave
- 109 Amaryllis Ave
- 113 Amaryllis Ave
- 113 Crossandra Ave
- 120 Crossandra Ave
- 115 Crossandra Ave
- 111 Crossandra Ave
- 107 Amaryllis Ave
- 115 Amaryllis Ave
- 117 Crossandra Ave
- 109 Crossandra Ave
- 119 Crossandra Ave
- 122 Crossandra Ave
- 107 Crossandra Ave