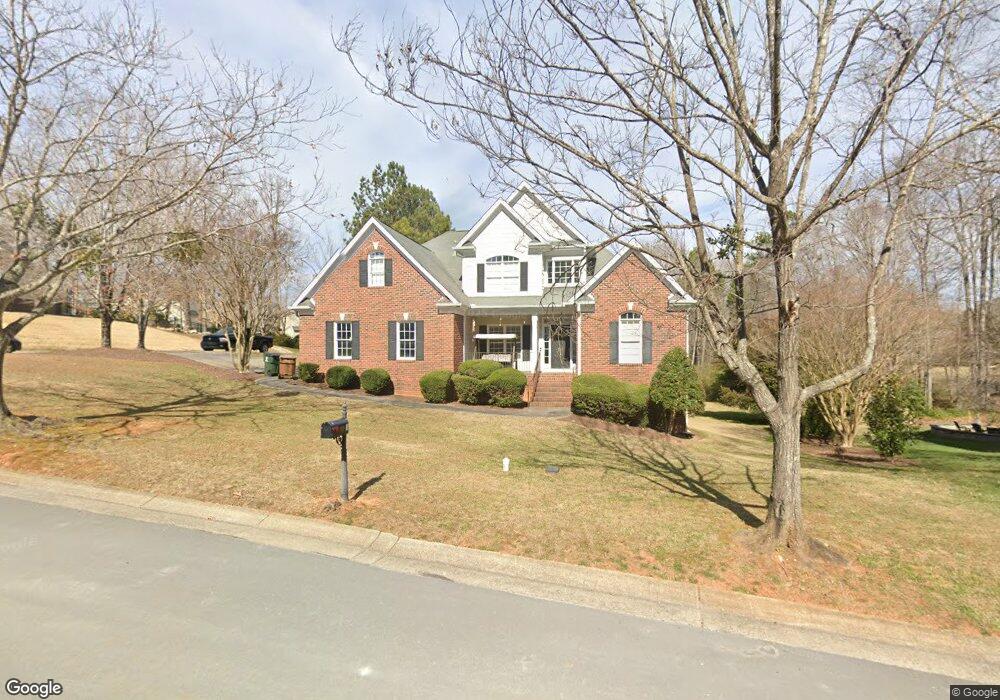
112 Crossway Ln Holly Springs, NC 27540
Estimated Value: $745,000 - $779,000
4
Beds
3
Baths
2,600
Sq Ft
$293/Sq Ft
Est. Value
About This Home
This home is located at 112 Crossway Ln, Holly Springs, NC 27540 and is currently estimated at $762,852, approximately $293 per square foot. 112 Crossway Ln is a home located in Wake County with nearby schools including Holly Springs Elementary School, Holly Ridge Middle School, and Holly Springs High School.
Ownership History
Date
Name
Owned For
Owner Type
Purchase Details
Closed on
Aug 8, 2002
Sold by
Olympus Servicing Lp
Bought by
Bolden James L and Bolden Melissa G
Current Estimated Value
Home Financials for this Owner
Home Financials are based on the most recent Mortgage that was taken out on this home.
Original Mortgage
$284,050
Outstanding Balance
$105,686
Interest Rate
4.87%
Estimated Equity
$657,166
Purchase Details
Closed on
May 6, 2002
Sold by
Sherrill Crystal
Bought by
Olympus Servicing Lp
Purchase Details
Closed on
Mar 9, 2001
Sold by
Mega Group Inc
Bought by
Sherrill Crystal
Home Financials for this Owner
Home Financials are based on the most recent Mortgage that was taken out on this home.
Original Mortgage
$318,250
Interest Rate
7.02%
Purchase Details
Closed on
Feb 25, 2000
Sold by
Sunset Forest Llc
Bought by
D & G Builders Inc
Home Financials for this Owner
Home Financials are based on the most recent Mortgage that was taken out on this home.
Original Mortgage
$39,125
Interest Rate
8.21%
Create a Home Valuation Report for This Property
The Home Valuation Report is an in-depth analysis detailing your home's value as well as a comparison with similar homes in the area
Home Values in the Area
Average Home Value in this Area
Purchase History
| Date | Buyer | Sale Price | Title Company |
|---|---|---|---|
| Bolden James L | $299,000 | -- | |
| Olympus Servicing Lp | $306,000 | -- | |
| Sherrill Crystal | $335,000 | -- | |
| Mega Group Inc | $280,000 | -- | |
| D & G Builders Inc | $36,500 | -- |
Source: Public Records
Mortgage History
| Date | Status | Borrower | Loan Amount |
|---|---|---|---|
| Open | Bolden James L | $284,050 | |
| Previous Owner | Mega Group Inc | $318,250 | |
| Previous Owner | D & G Builders Inc | $39,125 |
Source: Public Records
Tax History Compared to Growth
Tax History
| Year | Tax Paid | Tax Assessment Tax Assessment Total Assessment is a certain percentage of the fair market value that is determined by local assessors to be the total taxable value of land and additions on the property. | Land | Improvement |
|---|---|---|---|---|
| 2025 | $6,364 | $737,104 | $140,000 | $597,104 |
| 2024 | $6,337 | $737,104 | $140,000 | $597,104 |
| 2023 | $5,001 | $461,821 | $75,000 | $386,821 |
| 2022 | $4,828 | $461,821 | $75,000 | $386,821 |
| 2021 | $4,738 | $461,821 | $75,000 | $386,821 |
| 2020 | $4,738 | $461,821 | $75,000 | $386,821 |
| 2019 | $4,832 | $399,939 | $80,000 | $319,939 |
| 2018 | $4,367 | $399,939 | $80,000 | $319,939 |
| 2017 | $4,209 | $399,939 | $80,000 | $319,939 |
| 2016 | $4,151 | $399,939 | $80,000 | $319,939 |
| 2015 | $4,227 | $400,889 | $78,000 | $322,889 |
| 2014 | $4,081 | $400,889 | $78,000 | $322,889 |
Source: Public Records
Map
Nearby Homes
- 204 Crossway Ln
- 129 Starwood Ln
- 215 Savannah Ridge Rd Unit 215
- 305 Savannah Ridge Rd
- 0/416 Holly Springs Rd
- 4809 Greenpoint Ln
- 112 Midden Way
- 201 Seagraves Creek Ln
- 204 Seagraves Creek Ln
- 200 Seagraves Creek Ln
- 113 Seagraves Creek Ln
- 124 Seagraves Creek Ln
- 120 Seagraves Creek Ln
- 116 Seagraves Creek Ln
- 155 Writing Rock Place
- 157 Writing Rock Place
- 114 Pleasant Glen Ln
- 103 Pleasant Glen Ln
- 120 Ransomwood Dr
- 5200 Gable Ridge Ln
- 108 Crossway Ln
- 205 Starwood Ln
- 200 Crossway Ln
- 109 Crossway Ln
- 201 Starwood Ln
- 116 Ontario Place
- 105 Crossway Ln
- 113 Crossway Ln
- 201 Crossway Ln
- 113 Starwood Ln
- 113 Starwood Ln Unit 202
- 100 Crossway Ln
- 233 Elam St
- 101 Crossway Ln
- 137 Starwood Ln
- 112 Ontario Place
- 205 Crossway Ln
- 229 Elam St
- 208 Crossway Ln
- 133 Starwood Ln