112 Dock Landing Loop South Mills, NC 27976
Estimated Value: $416,000 - $473,000
3
Beds
3
Baths
2,306
Sq Ft
$192/Sq Ft
Est. Value
About This Home
This home is located at 112 Dock Landing Loop, South Mills, NC 27976 and is currently estimated at $443,461, approximately $192 per square foot. 112 Dock Landing Loop is a home located in Camden County with nearby schools including Grandy Primary School, Camden Intermediate School, and Camden Middle School.
Ownership History
Date
Name
Owned For
Owner Type
Purchase Details
Closed on
Jan 12, 2021
Sold by
Rust Michael J and Rust Cristy L
Bought by
Roberts Mark J and Roberts Erin C
Current Estimated Value
Home Financials for this Owner
Home Financials are based on the most recent Mortgage that was taken out on this home.
Original Mortgage
$273,015
Outstanding Balance
$243,193
Interest Rate
2.6%
Mortgage Type
FHA
Estimated Equity
$200,268
Purchase Details
Closed on
Dec 22, 2010
Sold by
Pnc Mortgage
Bought by
Rust Michael J and Rust Cristy L
Home Financials for this Owner
Home Financials are based on the most recent Mortgage that was taken out on this home.
Original Mortgage
$233,900
Interest Rate
4.83%
Mortgage Type
VA
Purchase Details
Closed on
Jun 22, 2010
Sold by
Young Charles Anthony
Bought by
Pnc Mortgage
Purchase Details
Closed on
Feb 6, 2007
Sold by
Hach Neil A and Hach Laura J
Bought by
Young Charles Anthony
Home Financials for this Owner
Home Financials are based on the most recent Mortgage that was taken out on this home.
Original Mortgage
$234,840
Interest Rate
6.19%
Mortgage Type
New Conventional
Create a Home Valuation Report for This Property
The Home Valuation Report is an in-depth analysis detailing your home's value as well as a comparison with similar homes in the area
Home Values in the Area
Average Home Value in this Area
Purchase History
| Date | Buyer | Sale Price | Title Company |
|---|---|---|---|
| Roberts Mark J | $278,052 | None Available | |
| Rust Michael J | $229,000 | -- | |
| Pnc Mortgage | $216,000 | -- | |
| Young Charles Anthony | $293,550 | -- |
Source: Public Records
Mortgage History
| Date | Status | Borrower | Loan Amount |
|---|---|---|---|
| Open | Roberts Mark J | $273,015 | |
| Previous Owner | Rust Michael J | $233,900 | |
| Previous Owner | Young Charles Anthony | $234,840 | |
| Previous Owner | Young Charles Anthony | $58,710 |
Source: Public Records
Tax History Compared to Growth
Tax History
| Year | Tax Paid | Tax Assessment Tax Assessment Total Assessment is a certain percentage of the fair market value that is determined by local assessors to be the total taxable value of land and additions on the property. | Land | Improvement |
|---|---|---|---|---|
| 2024 | $2,868 | $373,334 | $52,762 | $320,572 |
| 2023 | $1,892 | $373,334 | $52,762 | $320,572 |
| 2022 | $1,892 | $214,997 | $34,125 | $180,872 |
| 2021 | $1,892 | $214,997 | $34,125 | $180,872 |
| 2020 | $1,612 | $214,997 | $34,125 | $180,872 |
| 2019 | $1,591 | $214,997 | $34,125 | $180,872 |
| 2018 | $1,548 | $214,997 | $34,125 | $180,872 |
| 2017 | $1,548 | $214,997 | $34,125 | $180,872 |
| 2016 | $1,497 | $214,997 | $34,125 | $180,872 |
| 2015 | -- | $214,997 | $34,125 | $180,872 |
| 2014 | $1,992 | $321,232 | $69,400 | $251,832 |
Source: Public Records
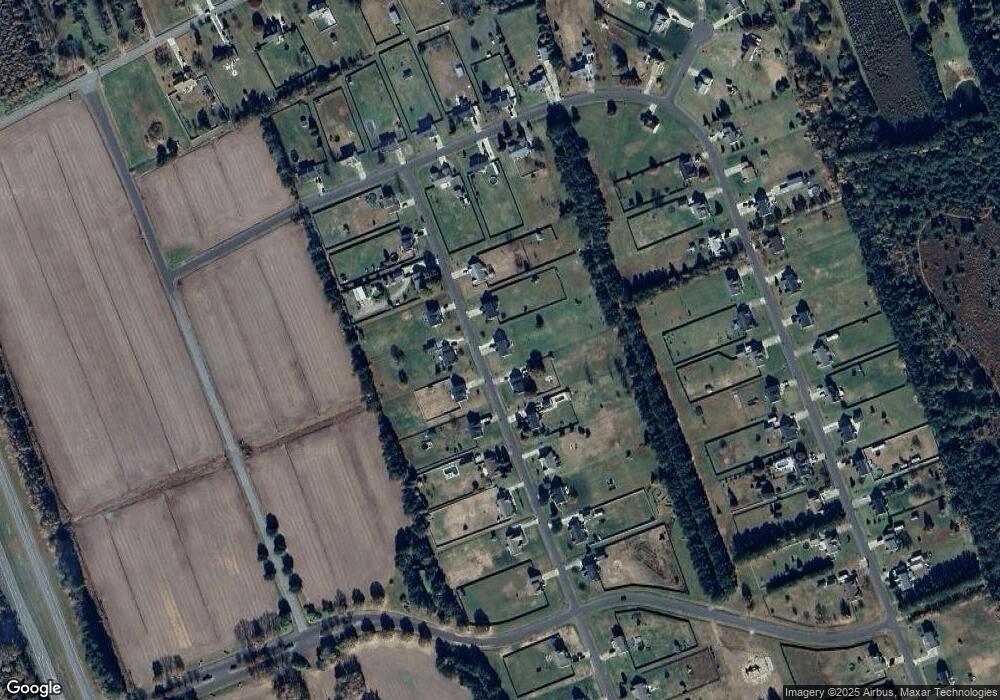
Map
Nearby Homes
- 119 Dock Landing Loop
- 102 Jasmine Ct
- 103 Jasmine Ct
- 105 Jasmine Ct
- 284 Mcpherson Rd
- 159 Keeter Barn Rd
- 127 Copper Run Loop
- 108 Copper Run Loop
- 130 Long Pine Rd
- 106 Copper Run Loop
- 125 Copper Run Loop
- 138` Copper Run Loop
- 101 Copper Run Loop
- 101 Copper Run Loop Unit Lot1
- 103 Copper Run Loop Unit Lot3
- 103 Copper Run Loop
- 104 Copper Run Loop
- 139 Copper Run Loop Unit Lot 20
- 139 Copper Run Loop
- 123 Copper Run Loop Unit Lot 12
- 114 Dock Landing Loop
- 111 Dock Landing Loop
- 115 Dock Landing Loop
- 106 Dock Landing Loop
- 116 Dock Landing Loop
- 117 Dock Landing Loop
- 109 Dock Landing Loop
- 107 Dock Landing Loop
- 118 Dock Landing Loop
- 103 Dock Landing Loop
- 122 Dock Landing Loop
- 121 Dock Landing Loop
- 117 Pier Landing
- 121 Pier Landing
- 101 Dock Landing Loop
- 123 Dock Landing Loop
- 123 Pier Landing
- 124 Dock Landing Loop
- 118 Pier Landing
- 114 Pier Landing