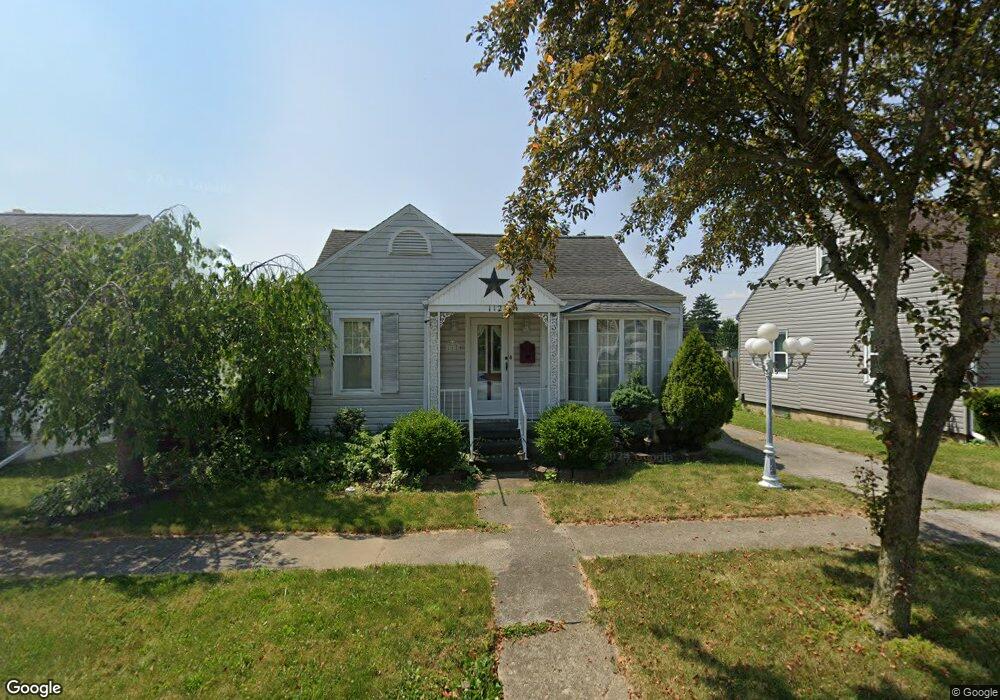
112 Douglas St Tiffin, OH 44883
Estimated Value: $135,981 - $152,000
2
Beds
1
Bath
1,152
Sq Ft
$122/Sq Ft
Est. Value
About This Home
This home is located at 112 Douglas St, Tiffin, OH 44883 and is currently estimated at $140,745, approximately $122 per square foot. 112 Douglas St is a home located in Seneca County with nearby schools including Columbian High School, Calvert Catholic Elementary School, and Calvert High School.
Ownership History
Date
Name
Owned For
Owner Type
Purchase Details
Closed on
Aug 19, 2019
Sold by
Estate Of Donna J Hurt
Bought by
Hurt Richard A and Hurt Cynthia L
Current Estimated Value
Purchase Details
Closed on
May 31, 2018
Sold by
Hurt Richard A and Marangio Cynthia L
Bought by
Hurt Donna J
Purchase Details
Closed on
Mar 27, 2015
Sold by
Hurt Donna J
Bought by
Donna J Hurt Irrevocable Trust
Purchase Details
Closed on
Feb 18, 2015
Sold by
Estate Of Arnold Hurt
Bought by
Hurst Donna J
Create a Home Valuation Report for This Property
The Home Valuation Report is an in-depth analysis detailing your home's value as well as a comparison with similar homes in the area
Home Values in the Area
Average Home Value in this Area
Purchase History
| Date | Buyer | Sale Price | Title Company |
|---|---|---|---|
| Hurt Richard A | -- | None Available | |
| Hurt Donna J | -- | None Available | |
| Hurt Richard A | -- | None Available | |
| Donna J Hurt Irrevocable Trust | -- | Attorney | |
| Hurst Donna J | -- | Attorney |
Source: Public Records
Tax History Compared to Growth
Tax History
| Year | Tax Paid | Tax Assessment Tax Assessment Total Assessment is a certain percentage of the fair market value that is determined by local assessors to be the total taxable value of land and additions on the property. | Land | Improvement |
|---|---|---|---|---|
| 2024 | $1,080 | $31,220 | $5,250 | $25,970 |
| 2023 | $1,081 | $31,220 | $5,250 | $25,970 |
| 2022 | $1,013 | $24,300 | $4,210 | $20,090 |
| 2021 | $1,021 | $24,300 | $4,210 | $20,090 |
| 2020 | $989 | $24,298 | $4,211 | $20,087 |
| 2019 | $1,022 | $23,664 | $4,200 | $19,464 |
| 2018 | $646 | $23,664 | $4,200 | $19,464 |
| 2017 | $605 | $23,664 | $4,200 | $19,464 |
| 2016 | $563 | $21,931 | $3,990 | $17,941 |
| 2015 | $557 | $21,931 | $3,990 | $17,941 |
| 2014 | $524 | $21,931 | $3,990 | $17,941 |
| 2013 | $590 | $23,044 | $4,200 | $18,844 |
Source: Public Records
Map
Nearby Homes