112 E Main St Sublimity, OR 97385
Estimated Value: $421,000 - $500,000
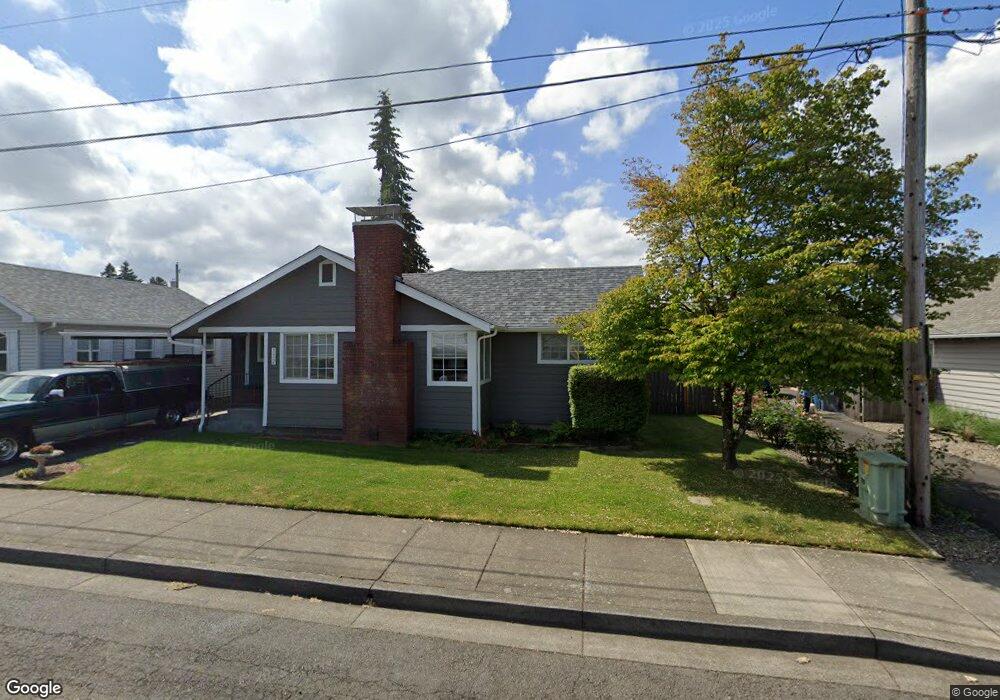
About This Home
This home is located at 112 E Main St, Sublimity, OR 97385 and is currently estimated at $460,400, approximately $278 per square foot. 112 E Main St is a home located in Marion County with nearby schools including Sublimity Elementary School, Stayton High School, and Regis St. Mary Catholic School.
Ownership History
We collect this data history from publicly available records. To have your information removed, we recommend requesting removal directly through your county’s website.
Purchase Details
Home Financials for this Owner
Home Financials are based on the most recent Mortgage that was taken out on this home.Purchase Details
Home Values in the Area
Average Home Value in this Area
Purchase History
We collect this data history from publicly available records. To have your information removed, we recommend requesting removal directly through your county’s website.
| Date | Buyer | Sale Price | Title Company |
|---|---|---|---|
| $330,000 | Ticor Title Company Of Or | ||
| -- | -- |
Mortgage History
We collect this data history from publicly available records. To have your information removed, we recommend requesting removal directly through your county’s website.
| Date | Status | Borrower | Loan Amount |
|---|---|---|---|
| Open | $313,500 |
Tax History
We collect this data history from publicly available records. To have your information removed, we recommend requesting removal directly through your county’s website.
| Year | Tax Paid | Tax Assessment Tax Assessment Total Assessment is a certain percentage of the fair market value that is determined by local assessors to be the total taxable value of land and additions on the property. | Land | Improvement |
|---|---|---|---|---|
| 2025 | $2,064 | $166,930 | -- | -- |
| 2024 | $2,064 | $162,070 | -- | -- |
| 2023 | $2,006 | $157,350 | $0 | $0 |
| 2022 | $1,869 | $152,770 | $0 | $0 |
| 2021 | $1,818 | $148,330 | $0 | $0 |
| 2020 | $1,766 | $144,010 | $0 | $0 |
| 2019 | $1,714 | $139,820 | $0 | $0 |
| 2018 | $1,738 | $0 | $0 | $0 |
| 2017 | $1,693 | $0 | $0 | $0 |
| 2016 | $1,648 | $0 | $0 | $0 |
| 2015 | $1,597 | $0 | $0 | $0 |
| 2014 | $1,542 | $0 | $0 | $0 |
Map
- 212 NE Broadway St
- 211 NE Broadway St
- 215 NE Broadway St
- 222 NE Broadway St
- 228 NE Broadway St
- 232 NE Broadway St
- 225 SW Hendricks St
- 315 NE Clay St
- 318 NE Clay St
- 220 NW Downy Dr
- 109 NW Felan Ln
- 340 NE Crest St Unit 49 St
- 340 NE Crest St Unit 5
- 313 NE Clay St
- 701 NW George Ct
- 702 NW George Ct
- 703 NW George Ct
- 704 NW George Ct
- 432 NW Heather Ave
- 0 NE Broadway (Lot Unit 2) St 827578
- 108 E Main St
- 102 S Center St
- 114 E Main St
- 111 SE Denny St
- 120 S Center St
- 115 SE Denny St
- 103 S Center St
- 103 Center St (Suite E)
- 111 S Center St
- 216 E Main St
- 113 E Main St
- 220 S Center St
- 217 SE Denny St
- 117 S Center St
- 114 SE Denny St
- 313 NE Clay (Lot Unit 16) St
- 221 NE Clay St
- 221 NE Clay St Unit 1
- 221 E Main St
- 222 E Main St
Ask me questions while you tour the home.