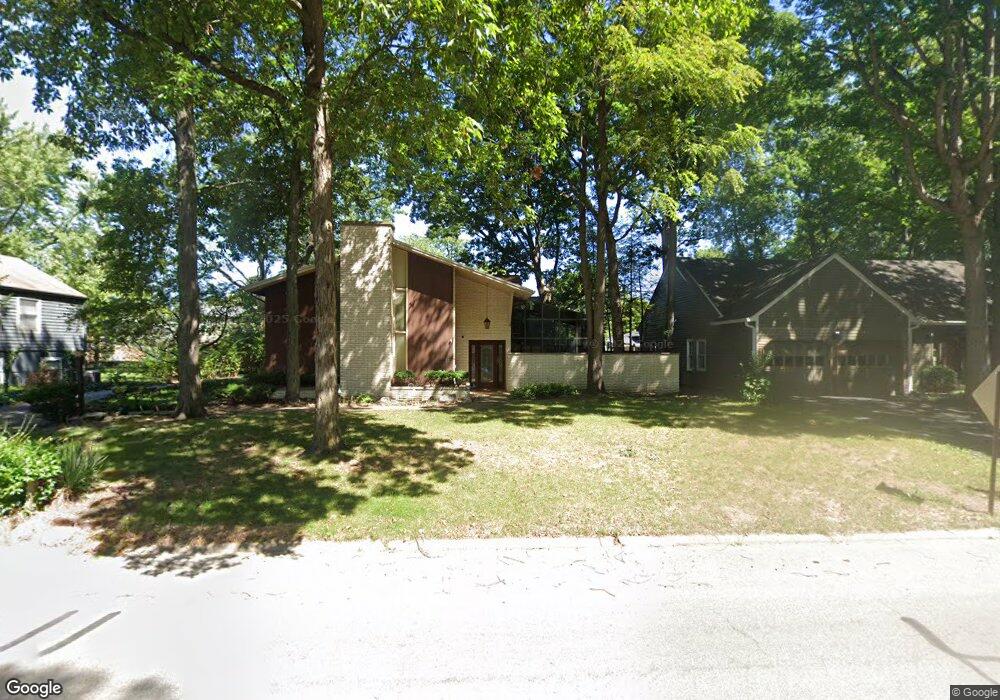
112 E Navajo St West Lafayette, IN 47906
Estimated Value: $389,000 - $606,000
5
Beds
3
Baths
3,256
Sq Ft
$153/Sq Ft
Est. Value
About This Home
This home is located at 112 E Navajo St, West Lafayette, IN 47906 and is currently estimated at $496,686, approximately $152 per square foot. 112 E Navajo St is a home located in Tippecanoe County with nearby schools including West Lafayette Intermediate School, West Lafayette Elementary School, and West Lafayette Junior/Senior High School.
Ownership History
Date
Name
Owned For
Owner Type
Purchase Details
Closed on
Apr 15, 2010
Sold by
Rice John R
Bought by
Park Kihong
Current Estimated Value
Home Financials for this Owner
Home Financials are based on the most recent Mortgage that was taken out on this home.
Original Mortgage
$251,750
Outstanding Balance
$81,664
Interest Rate
5.03%
Mortgage Type
New Conventional
Estimated Equity
$415,022
Create a Home Valuation Report for This Property
The Home Valuation Report is an in-depth analysis detailing your home's value as well as a comparison with similar homes in the area
Home Values in the Area
Average Home Value in this Area
Purchase History
| Date | Buyer | Sale Price | Title Company |
|---|---|---|---|
| Park Kihong | -- | None Available |
Source: Public Records
Mortgage History
| Date | Status | Borrower | Loan Amount |
|---|---|---|---|
| Open | Park Kihong | $251,750 |
Source: Public Records
Tax History Compared to Growth
Tax History
| Year | Tax Paid | Tax Assessment Tax Assessment Total Assessment is a certain percentage of the fair market value that is determined by local assessors to be the total taxable value of land and additions on the property. | Land | Improvement |
|---|---|---|---|---|
| 2024 | $4,995 | $414,700 | $87,800 | $326,900 |
| 2023 | $4,670 | $390,900 | $87,800 | $303,100 |
| 2022 | $4,422 | $366,100 | $87,800 | $278,300 |
| 2021 | $3,647 | $303,600 | $45,000 | $258,600 |
| 2020 | $3,319 | $277,200 | $45,000 | $232,200 |
| 2019 | $3,177 | $265,700 | $45,000 | $220,700 |
| 2018 | $3,034 | $254,200 | $33,500 | $220,700 |
| 2017 | $2,869 | $240,900 | $33,500 | $207,400 |
| 2016 | $2,797 | $235,100 | $33,500 | $201,600 |
| 2014 | $2,533 | $216,900 | $33,500 | $183,400 |
| 2013 | $2,428 | $208,300 | $33,500 | $174,800 |
Source: Public Records
Map
Nearby Homes
- 106 W Navajo St
- 2200 Miami Trail
- 631 Kent Ave
- 624 Kent Ave
- 448 Westview Cir
- 2801 Henderson St
- 1912 Indian Trail Dr
- 218 Myrtle Dr
- 1909 Indian Trail Dr
- 2825 Henderson St
- 2861 Linda Ln W
- 2843 Barlow St
- 2306 Carmel Dr
- 2212 Sycamore Ln
- 213 Hartman Ct
- 1868 N River Rd
- 500 Carrolton Blvd
- 509 Carrolton Blvd
- 3040 Hamilton St
- 502 Hillcrest Rd