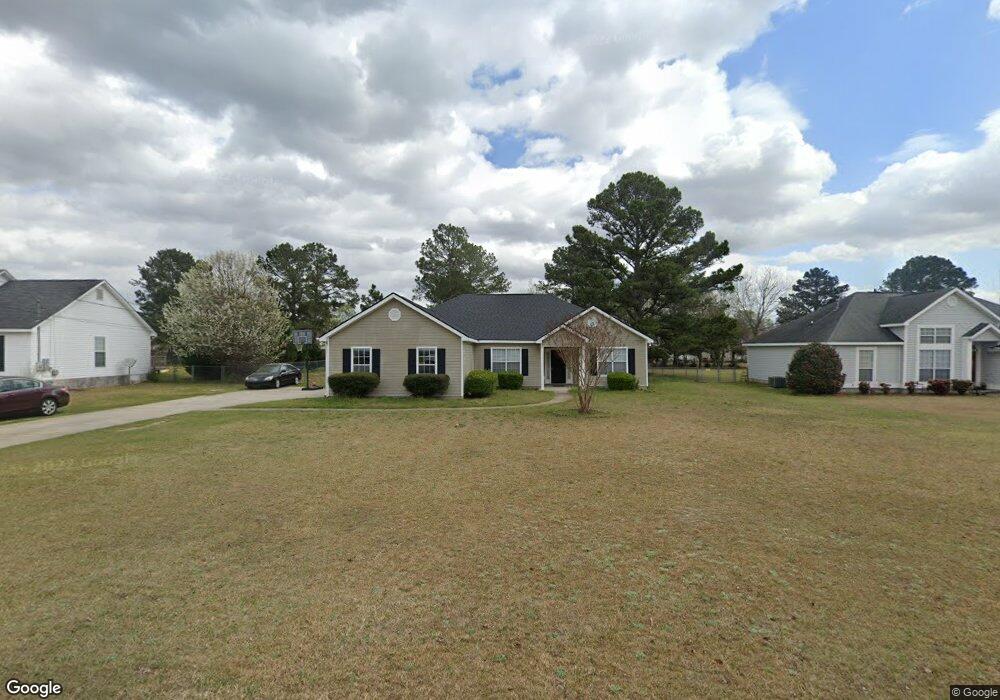
112 Ellis Way Macon, GA 31216
Estimated Value: $252,383 - $273,000
3
Beds
2
Baths
1,741
Sq Ft
$150/Sq Ft
Est. Value
About This Home
This home is located at 112 Ellis Way, Macon, GA 31216 and is currently estimated at $261,846, approximately $150 per square foot. 112 Ellis Way is a home located in Bibb County with nearby schools including Porter Elementary School, Rutland Middle School, and Rutland High School.
Ownership History
Date
Name
Owned For
Owner Type
Purchase Details
Closed on
Nov 17, 2004
Bought by
Sanders Christopher and Sanders
Current Estimated Value
Home Financials for this Owner
Home Financials are based on the most recent Mortgage that was taken out on this home.
Original Mortgage
$135,850
Outstanding Balance
$78,480
Interest Rate
8.34%
Mortgage Type
Adjustable Rate Mortgage/ARM
Estimated Equity
$183,366
Purchase Details
Closed on
Feb 28, 2004
Bought by
Sanders Christopher and Sanders
Purchase Details
Closed on
Jun 27, 1997
Create a Home Valuation Report for This Property
The Home Valuation Report is an in-depth analysis detailing your home's value as well as a comparison with similar homes in the area
Home Values in the Area
Average Home Value in this Area
Purchase History
| Date | Buyer | Sale Price | Title Company |
|---|---|---|---|
| Sanders Christopher | -- | -- | |
| Collier Wendell | -- | None Available | |
| Sanders Christopher | $142,000 | -- | |
| -- | $99,900 | -- |
Source: Public Records
Mortgage History
| Date | Status | Borrower | Loan Amount |
|---|---|---|---|
| Open | Collier Wendell | $135,850 |
Source: Public Records
Tax History Compared to Growth
Tax History
| Year | Tax Paid | Tax Assessment Tax Assessment Total Assessment is a certain percentage of the fair market value that is determined by local assessors to be the total taxable value of land and additions on the property. | Land | Improvement |
|---|---|---|---|---|
| 2025 | $1,964 | $86,938 | $14,000 | $72,938 |
| 2024 | $2,028 | $86,838 | $14,000 | $72,838 |
| 2023 | $1,237 | $73,703 | $14,000 | $59,703 |
| 2022 | $2,226 | $71,296 | $8,378 | $62,918 |
| 2021 | $2,096 | $62,154 | $7,040 | $55,114 |
| 2020 | $1,963 | $57,549 | $6,336 | $51,213 |
| 2019 | $1,856 | $54,406 | $5,632 | $48,774 |
| 2018 | $2,876 | $51,967 | $5,632 | $46,335 |
| 2017 | $1,603 | $49,792 | $5,896 | $43,896 |
| 2016 | $1,480 | $49,793 | $5,896 | $43,896 |
| 2015 | $1,733 | $42,387 | $5,896 | $36,491 |
| 2014 | $1,736 | $42,387 | $5,896 | $36,491 |
Source: Public Records
Map
Nearby Homes