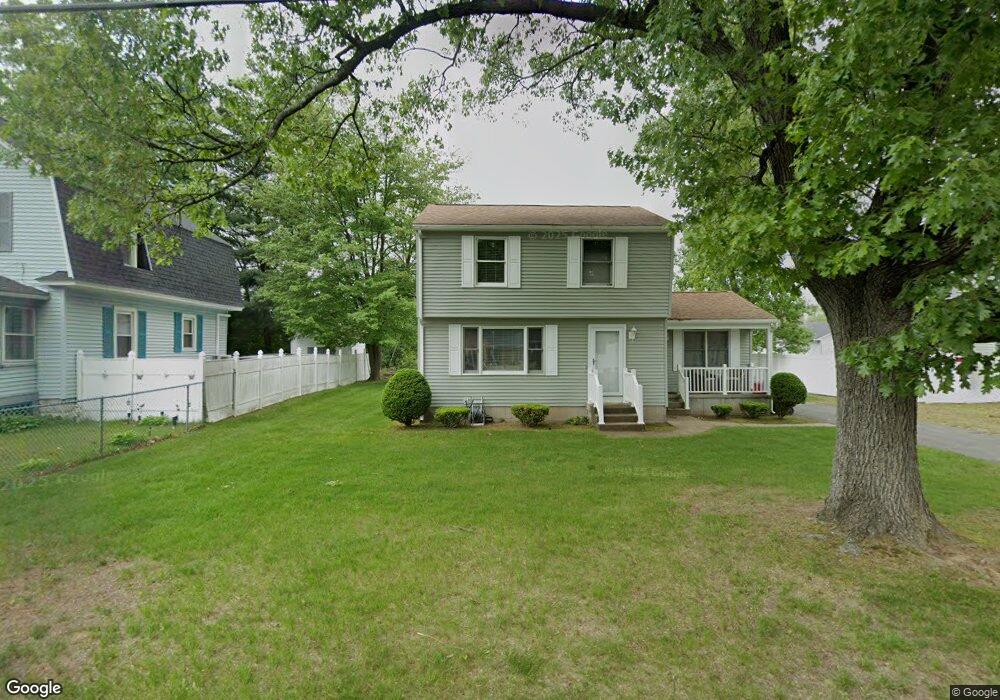
112 Fargo St Springfield, MA 01119
Pine Point NeighborhoodEstimated Value: $294,297 - $345,000
3
Beds
2
Baths
1,344
Sq Ft
$236/Sq Ft
Est. Value
About This Home
This home is located at 112 Fargo St, Springfield, MA 01119 and is currently estimated at $316,824, approximately $235 per square foot. 112 Fargo St is a home located in Hampden County with nearby schools including Thomas M Balliet Elementary School, John J Duggan Middle, and Springfield Central High School.
Ownership History
Date
Name
Owned For
Owner Type
Purchase Details
Closed on
Oct 28, 1993
Sold by
Sears Mtg Corp
Bought by
Bell Debra
Current Estimated Value
Home Financials for this Owner
Home Financials are based on the most recent Mortgage that was taken out on this home.
Original Mortgage
$78,200
Interest Rate
6.86%
Mortgage Type
Purchase Money Mortgage
Purchase Details
Closed on
Oct 5, 1992
Sold by
Gay Francis J
Bought by
City Fedl Sb
Purchase Details
Closed on
Aug 14, 1987
Sold by
Joseph J Deliso Ft
Bought by
Jc-Becon Rlty Inc
Home Financials for this Owner
Home Financials are based on the most recent Mortgage that was taken out on this home.
Original Mortgage
$0
Interest Rate
10.34%
Mortgage Type
Purchase Money Mortgage
Create a Home Valuation Report for This Property
The Home Valuation Report is an in-depth analysis detailing your home's value as well as a comparison with similar homes in the area
Home Values in the Area
Average Home Value in this Area
Purchase History
| Date | Buyer | Sale Price | Title Company |
|---|---|---|---|
| Bell Debra | $78,000 | -- | |
| City Fedl Sb | $81,936 | -- | |
| Jc-Becon Rlty Inc | $5,000 | -- |
Source: Public Records
Mortgage History
| Date | Status | Borrower | Loan Amount |
|---|---|---|---|
| Open | Jc-Becon Rlty Inc | $12,750 | |
| Closed | Jc-Becon Rlty Inc | $78,200 | |
| Previous Owner | Jc-Becon Rlty Inc | $10,400 | |
| Previous Owner | Jc-Becon Rlty Inc | $0 |
Source: Public Records
Tax History
| Year | Tax Paid | Tax Assessment Tax Assessment Total Assessment is a certain percentage of the fair market value that is determined by local assessors to be the total taxable value of land and additions on the property. | Land | Improvement |
|---|---|---|---|---|
| 2025 | $4,234 | $270,000 | $40,200 | $229,800 |
| 2024 | $3,962 | $246,700 | $40,200 | $206,500 |
| 2023 | $4,228 | $248,000 | $35,600 | $212,400 |
| 2022 | $4,396 | $233,600 | $33,200 | $200,400 |
| 2021 | $3,593 | $190,100 | $30,200 | $159,900 |
| 2020 | $3,250 | $166,400 | $30,200 | $136,200 |
| 2019 | $3,100 | $157,500 | $31,300 | $126,200 |
| 2018 | $3,178 | $161,500 | $31,300 | $130,200 |
| 2017 | $3,018 | $153,500 | $34,500 | $119,000 |
| 2016 | $2,566 | $130,500 | $34,500 | $96,000 |
| 2015 | $2,671 | $135,800 | $34,500 | $101,300 |
Source: Public Records
Map
Nearby Homes
Your Personal Tour Guide
Ask me questions while you tour the home.