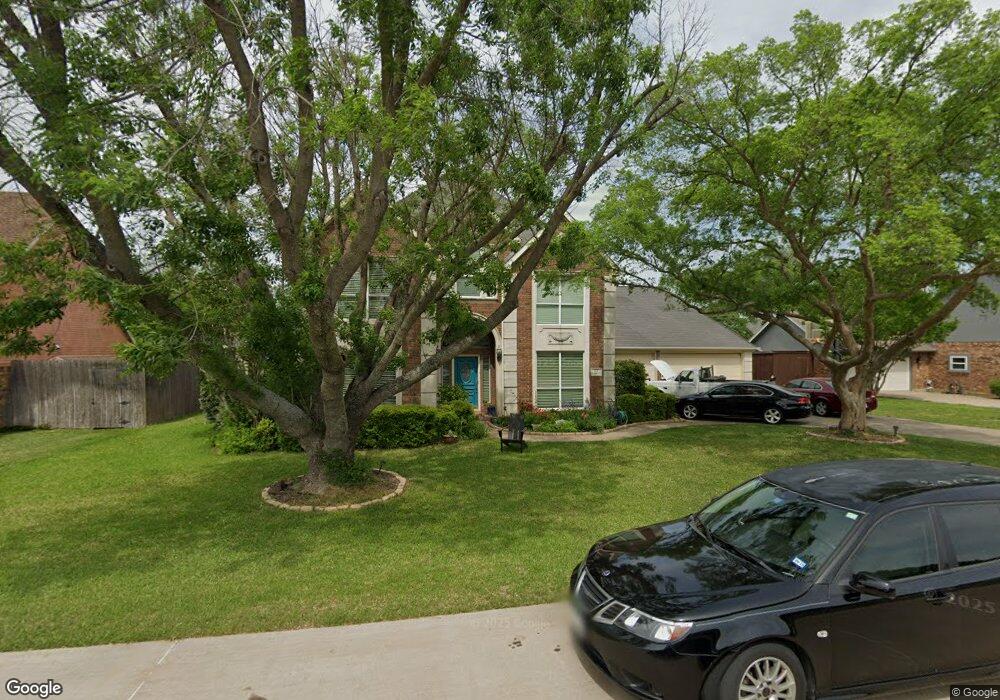
112 Fieldcrest Loop Coppell, TX 75019
Estimated Value: $757,000 - $927,000
4
Beds
4
Baths
3,449
Sq Ft
$234/Sq Ft
Est. Value
About This Home
This home is located at 112 Fieldcrest Loop, Coppell, TX 75019 and is currently estimated at $805,925, approximately $233 per square foot. 112 Fieldcrest Loop is a home located in Dallas County with nearby schools including Wilson Elementary School, Coppell Middle North, and Coppell High School.
Ownership History
Date
Name
Owned For
Owner Type
Purchase Details
Closed on
Sep 12, 2011
Sold by
Boswell David and Boswell Kaye
Bought by
Keany Desmond John and Keany Barbara
Current Estimated Value
Home Financials for this Owner
Home Financials are based on the most recent Mortgage that was taken out on this home.
Original Mortgage
$275,000
Outstanding Balance
$189,841
Interest Rate
4.43%
Mortgage Type
New Conventional
Estimated Equity
$616,084
Purchase Details
Closed on
Jun 21, 2004
Sold by
Boswell Mark S
Bought by
Boswell David and Boswell Kaye
Home Financials for this Owner
Home Financials are based on the most recent Mortgage that was taken out on this home.
Original Mortgage
$264,000
Interest Rate
6.65%
Mortgage Type
Stand Alone Refi Refinance Of Original Loan
Purchase Details
Closed on
Jun 4, 1998
Sold by
Garlock Richard T and Garlock Donna M
Bought by
Boswell Mark S and Boswell Kellie C
Home Financials for this Owner
Home Financials are based on the most recent Mortgage that was taken out on this home.
Original Mortgage
$199,900
Interest Rate
6.62%
Create a Home Valuation Report for This Property
The Home Valuation Report is an in-depth analysis detailing your home's value as well as a comparison with similar homes in the area
Home Values in the Area
Average Home Value in this Area
Purchase History
| Date | Buyer | Sale Price | Title Company |
|---|---|---|---|
| Keany Desmond John | -- | None Available | |
| Boswell David | -- | Stnt | |
| Boswell Mark S | -- | -- |
Source: Public Records
Mortgage History
| Date | Status | Borrower | Loan Amount |
|---|---|---|---|
| Open | Keany Desmond John | $275,000 | |
| Previous Owner | Boswell David | $264,000 | |
| Previous Owner | Boswell Mark S | $199,900 | |
| Closed | Boswell Mark S | $37,450 |
Source: Public Records
Tax History
| Year | Tax Paid | Tax Assessment Tax Assessment Total Assessment is a certain percentage of the fair market value that is determined by local assessors to be the total taxable value of land and additions on the property. | Land | Improvement |
|---|---|---|---|---|
| 2025 | $7,877 | $615,480 | $110,000 | $505,480 |
| 2024 | $7,877 | $615,480 | $110,000 | $505,480 |
| 2023 | $7,877 | $550,000 | $120,000 | $430,000 |
| 2022 | $12,681 | $550,000 | $120,000 | $430,000 |
| 2021 | $12,326 | $495,320 | $80,000 | $415,320 |
| 2020 | $12,531 | $495,320 | $80,000 | $415,320 |
| 2019 | $13,164 | $490,000 | $80,000 | $410,000 |
| 2018 | $13,298 | $490,000 | $80,000 | $410,000 |
| 2017 | $11,180 | $410,000 | $60,000 | $350,000 |
| 2016 | $11,796 | $432,590 | $60,000 | $372,590 |
| 2015 | $8,826 | $397,820 | $60,000 | $337,820 |
| 2014 | $8,826 | $353,770 | $60,000 | $293,770 |
Source: Public Records
Map
Nearby Homes
- 100 Fieldcrest Loop
- 423 Halifax Dr
- 113 Summer Place Dr
- 473 Leisure Ln
- 337 Plantation Dr
- 406 Spanish Moss Ct
- 309 Kaye St
- 336 Kaye St
- 212 Heather Glen Dr
- 229 S Heartz Rd
- 125 Bricknell Ln
- 634 Oakbend Dr
- 100 Branchwood Trail
- 115 Flintshire Way
- 644 Burning Tree Ln
- 515 Avalon Banks
- 511 Avalon Bank
- 323 Gifford Dr
- 303 Woodhurst Dr
- 117 Sand Point Ct
- 144 Georgian Dr
- 148 Georgian Dr
- 108 Fieldcrest Loop
- 116 Fieldcrest Loop
- 140 Georgian Dr
- 152 Georgian Dr
- 156 Georgian Dr
- 120 Fieldcrest Loop
- 104 Fieldcrest Loop
- 150 Fieldcrest Cir
- 136 Georgian Dr
- 123 Georgian Dr
- 132 Georgian Dr
- 160 Georgian Dr
- 163 Georgian Dr
- 128 Georgian Dr
- 124 Fieldcrest Loop
- 500 Fieldcrest Cir
- 130 Whispering Hills Dr
- 119 Georgian Dr
Your Personal Tour Guide
Ask me questions while you tour the home.