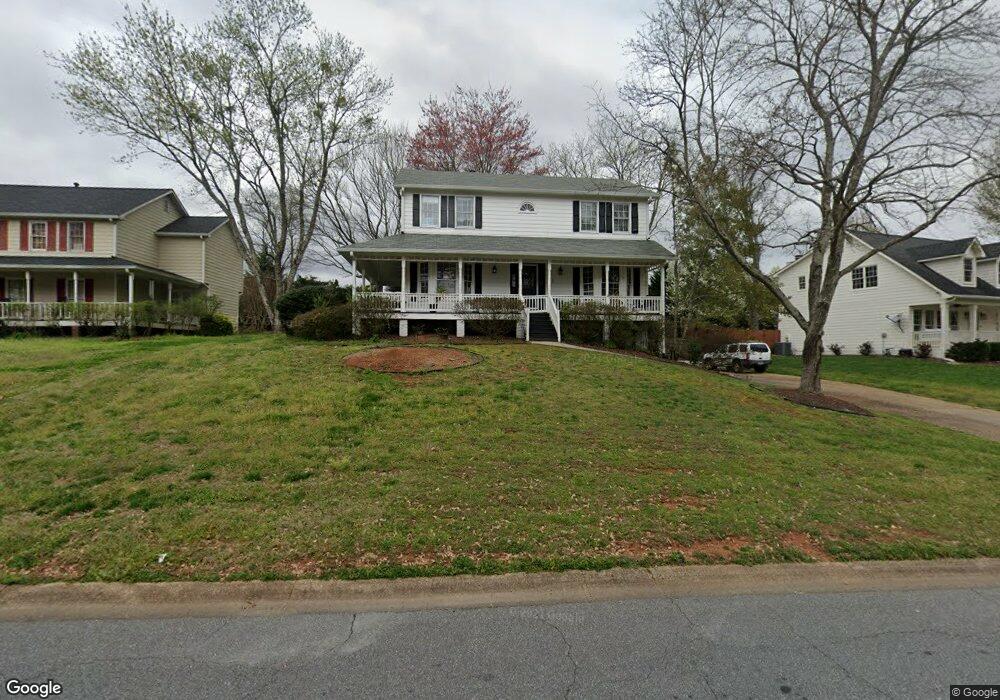
112 Fitchburg Dr Unit 1 Woodstock, GA 30189
Oak Grove NeighborhoodEstimated Value: $412,256 - $432,000
3
Beds
3
Baths
2,430
Sq Ft
$174/Sq Ft
Est. Value
About This Home
This home is located at 112 Fitchburg Dr Unit 1, Woodstock, GA 30189 and is currently estimated at $422,128, approximately $173 per square foot. 112 Fitchburg Dr Unit 1 is a home located in Cherokee County with nearby schools including Carmel Elementary School, Woodstock Middle School, and Woodstock High School.
Ownership History
Date
Name
Owned For
Owner Type
Purchase Details
Closed on
Sep 16, 2002
Sold by
Hubert John D
Bought by
Macgillivary Carlotta L
Current Estimated Value
Home Financials for this Owner
Home Financials are based on the most recent Mortgage that was taken out on this home.
Original Mortgage
$160,630
Outstanding Balance
$66,754
Interest Rate
6.3%
Mortgage Type
FHA
Estimated Equity
$355,374
Purchase Details
Closed on
Mar 26, 1997
Sold by
Vitulli Debra
Bought by
Lewis Donna
Purchase Details
Closed on
Nov 29, 1994
Sold by
Albrecht Keith A Lori J
Bought by
Vitulli Debra A
Home Financials for this Owner
Home Financials are based on the most recent Mortgage that was taken out on this home.
Original Mortgage
$109,000
Interest Rate
9.26%
Create a Home Valuation Report for This Property
The Home Valuation Report is an in-depth analysis detailing your home's value as well as a comparison with similar homes in the area
Home Values in the Area
Average Home Value in this Area
Purchase History
| Date | Buyer | Sale Price | Title Company |
|---|---|---|---|
| Macgillivary Carlotta L | $161,900 | -- | |
| Lewis Donna | $126,300 | -- | |
| Vitulli Debra A | $119,000 | -- |
Source: Public Records
Mortgage History
| Date | Status | Borrower | Loan Amount |
|---|---|---|---|
| Open | Macgillivary Carlotta L | $160,630 | |
| Previous Owner | Vitulli Debra A | $109,000 | |
| Closed | Lewis Donna | $0 |
Source: Public Records
Tax History Compared to Growth
Tax History
| Year | Tax Paid | Tax Assessment Tax Assessment Total Assessment is a certain percentage of the fair market value that is determined by local assessors to be the total taxable value of land and additions on the property. | Land | Improvement |
|---|---|---|---|---|
| 2025 | $3,249 | $139,528 | $36,000 | $103,528 |
| 2024 | $3,162 | $136,048 | $32,000 | $104,048 |
| 2023 | $2,524 | $126,368 | $32,000 | $94,368 |
| 2022 | $2,593 | $107,528 | $24,000 | $83,528 |
| 2021 | $2,333 | $87,088 | $16,800 | $70,288 |
| 2020 | $2,301 | $85,648 | $16,800 | $68,848 |
| 2019 | $2,094 | $76,720 | $16,800 | $59,920 |
| 2018 | $2,025 | $73,280 | $16,800 | $56,480 |
| 2017 | $1,734 | $172,600 | $16,800 | $52,240 |
| 2016 | $1,734 | $154,700 | $14,400 | $47,480 |
| 2015 | $1,707 | $150,900 | $14,400 | $45,960 |
| 2014 | $1,622 | $143,400 | $14,000 | $43,360 |
Source: Public Records
Map
Nearby Homes
- 319 Hayden Cir
- 350 Hayden Cir
- 356 Hayden Cir
- 354 Hayden Cir
- 360 Hayden Cir
- 150 Holden Way
- 101 Holden Way
- 316 Woodson Way
- 418 Lanier Cir
- 346 Lanier Cir
- 336 Lanier Cir
- 342 Lanier Cir
- 358 Lanier Cir
- 362 Lanier Cir
- 422 Lanier Cir
- 370 Lanier Cir
- 374 Lanier Cir
- 303 Woodson Way
- 427 Lanier Cir
- 423 Lanier Cir
- 110 Fitchburg Dr
- 114 Fitchburg Dr
- 327 Hayden Cir
- 108 Fitchburg Dr
- 116 Fitchburg Dr
- 113 Fitchburg Dr
- 325 Hayden Cir
- 111 Fitchburg Dr
- 329 Hayden Cir
- 333 Hayden Cir
- 115 Fitchburg Dr
- 000 Smith Dr
- 335 Hayden Cir
- 109 Fitchburg Dr
- 321 Hayden Cir Unit 10
- 321 Hayden Cir
- 337 Hayden Cir
- 339 Hayden Cir
- 118 Fitchburg Dr
- 311 Hayden Cir Unit 5