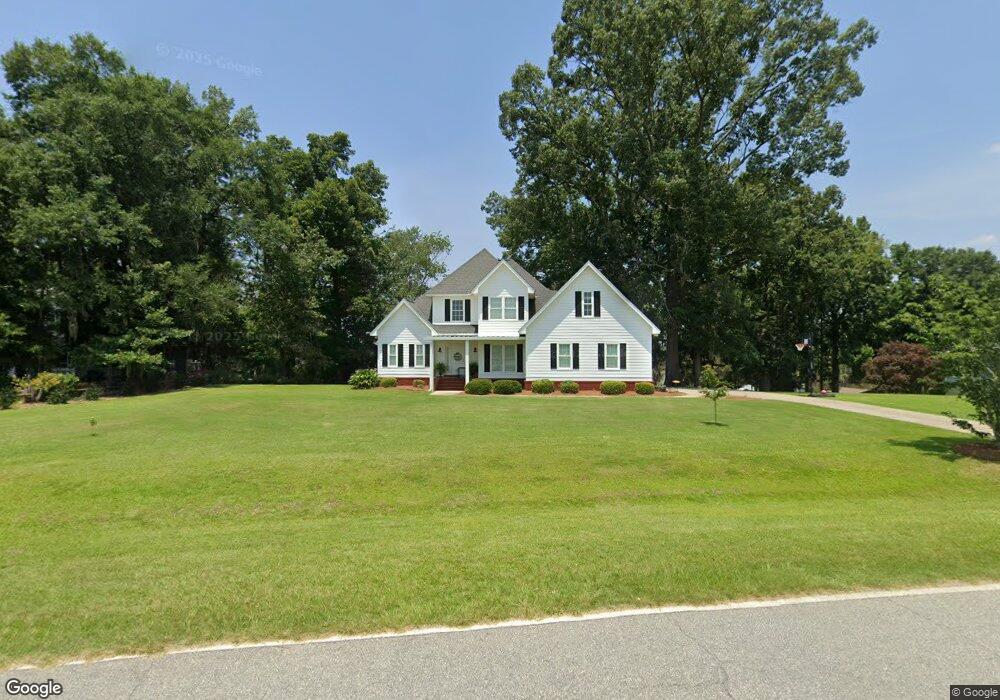
112 Flintview Dr Cordele, GA 31015
Estimated Value: $457,000 - $518,000
3
Beds
3
Baths
1,579
Sq Ft
$302/Sq Ft
Est. Value
About This Home
This home is located at 112 Flintview Dr, Cordele, GA 31015 and is currently estimated at $477,344, approximately $302 per square foot. 112 Flintview Dr is a home located in Crisp County with nearby schools including Crisp County Elementary School, Crisp County Primary School, and Crisp County Middle School.
Ownership History
Date
Name
Owned For
Owner Type
Purchase Details
Closed on
Aug 8, 2019
Sold by
Buriss E Roeber
Bought by
Owens Daniel R
Current Estimated Value
Home Financials for this Owner
Home Financials are based on the most recent Mortgage that was taken out on this home.
Original Mortgage
$271,600
Outstanding Balance
$236,836
Interest Rate
3.7%
Mortgage Type
New Conventional
Estimated Equity
$240,508
Purchase Details
Closed on
Sep 25, 2007
Sold by
Burriss E Roeber
Bought by
Hall F Gene
Purchase Details
Closed on
Sep 19, 2007
Sold by
Hall Eugene F
Bought by
Burriss E Roeber
Purchase Details
Closed on
Jun 18, 1991
Sold by
Pless Andrew J
Bought by
Hall Hall F and Hall Lillian
Purchase Details
Closed on
Dec 28, 1990
Sold by
Wells Marvin
Bought by
Pless Andrew J
Purchase Details
Closed on
Dec 27, 1990
Sold by
Wells A S
Bought by
Wells Marvin
Create a Home Valuation Report for This Property
The Home Valuation Report is an in-depth analysis detailing your home's value as well as a comparison with similar homes in the area
Home Values in the Area
Average Home Value in this Area
Purchase History
| Date | Buyer | Sale Price | Title Company |
|---|---|---|---|
| Owens Daniel R | $280,000 | -- | |
| Hall F Gene | -- | -- | |
| Burriss E Roeber | $200,000 | -- | |
| Hall Hall F | $19,000 | -- | |
| Pless Andrew J | $19,500 | -- | |
| Wells Marvin | -- | -- |
Source: Public Records
Mortgage History
| Date | Status | Borrower | Loan Amount |
|---|---|---|---|
| Open | Owens Daniel R | $271,600 |
Source: Public Records
Tax History Compared to Growth
Tax History
| Year | Tax Paid | Tax Assessment Tax Assessment Total Assessment is a certain percentage of the fair market value that is determined by local assessors to be the total taxable value of land and additions on the property. | Land | Improvement |
|---|---|---|---|---|
| 2025 | $4,278 | $168,329 | $59,207 | $109,122 |
| 2024 | $4,278 | $158,015 | $59,207 | $98,808 |
| 2023 | $3,559 | $126,735 | $54,470 | $72,265 |
| 2022 | $3,448 | $122,782 | $54,470 | $68,312 |
| 2021 | $3,282 | $110,694 | $54,470 | $56,224 |
| 2020 | $3,287 | $110,694 | $54,470 | $56,224 |
| 2019 | $3,266 | $110,694 | $54,470 | $56,224 |
| 2018 | $3,726 | $121,679 | $58,450 | $63,229 |
| 2017 | $3,742 | $121,679 | $58,450 | $63,229 |
| 2016 | $3,737 | $121,679 | $58,450 | $63,229 |
| 2015 | -- | $121,679 | $58,450 | $63,229 |
| 2014 | -- | $121,679 | $58,450 | $63,229 |
| 2013 | -- | $121,678 | $58,449 | $63,229 |
Source: Public Records
Map
Nearby Homes
- 106 Flintview Dr
- 1 Flintview Dr
- 4 Flintview Dr
- 2 Flintview Dr
- 3 Flintview Dr
- 84 Flintview Dr
- TBD Sawdust Trail
- 0 Statham Lake Front
- TBD N Spring Creek Cir
- 0 N Spring Creek Cir
- 101 Bass Rd
- 252 N Spring Creek Cir
- 800 Drayton Loop
- 18 Redbreast Dr
- 104 Redbreast Dr
- 1020 Flathead Dr
- 108 N Spring Creek Cir
- 320 Drayton Woods Rd
- 115 Cypress Ln
- 113 Cypress Ln
- 116 Flintview Dr
- 110 Flintview Dr
- 142 Flintview Dr
- 0 Flintview Dr Unit LOT 9 10244413
- 0 Flintview Dr Unit 53172
- 0 Flintview Dr Unit 53171
- 0 Flintview Dr Unit 53170
- 0 Flintview Dr Unit 53161
- 0 Flintview Dr Unit 11103
- 0 Flintview Dr Unit 50918
- 0 Flintview Dr Unit 10118
- 0 Flintview Dr Unit 54266
- 0 Flintview Dr Unit 57021
- 108 Flintview Dr
- 120 Flintview Dr
- 108 Fintview Dr
- lot 10 the Refuge On Flintview Dr
- 124 Flintview Dr
- 278 Flintview Dr
- 282 Flintview Dr