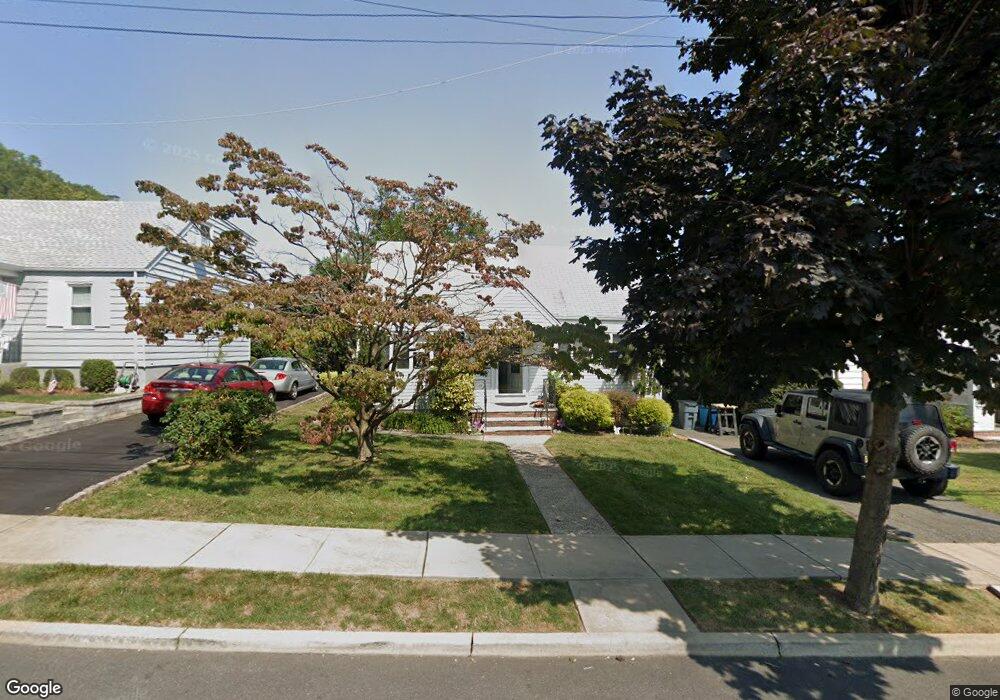
112 Fordham Rd Clifton, NJ 07013
Albion NeighborhoodEstimated Value: $436,000 - $546,000
--
Bed
--
Bath
1,152
Sq Ft
$429/Sq Ft
Est. Value
About This Home
This home is located at 112 Fordham Rd, Clifton, NJ 07013 and is currently estimated at $494,145, approximately $428 per square foot. 112 Fordham Rd is a home located in Passaic County with nearby schools including Clifton High School, The Magical Palace of Knowledge, and Saint Philip the Apostle Preparatory School.
Ownership History
Date
Name
Owned For
Owner Type
Purchase Details
Closed on
May 1, 2019
Sold by
Rudy Charles and Rudy Jeanette
Bought by
Rudy Jeanette
Current Estimated Value
Purchase Details
Closed on
Jul 26, 2006
Sold by
Singh Joginder
Bought by
Rudy Charles and Rudy Jeanette
Home Financials for this Owner
Home Financials are based on the most recent Mortgage that was taken out on this home.
Original Mortgage
$260,000
Outstanding Balance
$155,335
Interest Rate
6.67%
Mortgage Type
New Conventional
Estimated Equity
$338,810
Purchase Details
Closed on
May 19, 2000
Sold by
Grapes Patricia
Bought by
Singh Joginder and Kaur Narinder
Home Financials for this Owner
Home Financials are based on the most recent Mortgage that was taken out on this home.
Original Mortgage
$126,400
Interest Rate
8.48%
Create a Home Valuation Report for This Property
The Home Valuation Report is an in-depth analysis detailing your home's value as well as a comparison with similar homes in the area
Home Values in the Area
Average Home Value in this Area
Purchase History
| Date | Buyer | Sale Price | Title Company |
|---|---|---|---|
| Rudy Jeanette | -- | None Available | |
| Rudy Charles | $330,000 | -- | |
| Singh Joginder | $158,000 | Chicago Title Insurance Co |
Source: Public Records
Mortgage History
| Date | Status | Borrower | Loan Amount |
|---|---|---|---|
| Open | Rudy Charles | $260,000 | |
| Previous Owner | Singh Joginder | $126,400 |
Source: Public Records
Tax History Compared to Growth
Tax History
| Year | Tax Paid | Tax Assessment Tax Assessment Total Assessment is a certain percentage of the fair market value that is determined by local assessors to be the total taxable value of land and additions on the property. | Land | Improvement |
|---|---|---|---|---|
| 2025 | $8,524 | $143,600 | $95,000 | $48,600 |
| 2024 | $8,320 | $143,600 | $95,000 | $48,600 |
| 2022 | $8,200 | $143,600 | $95,000 | $48,600 |
| 2021 | $7,862 | $143,600 | $95,000 | $48,600 |
| 2020 | $7,888 | $143,600 | $95,000 | $48,600 |
| 2019 | $7,832 | $143,600 | $95,000 | $48,600 |
| 2018 | $7,787 | $143,600 | $95,000 | $48,600 |
| 2017 | $7,703 | $143,600 | $95,000 | $48,600 |
| 2016 | $7,553 | $143,600 | $95,000 | $48,600 |
| 2015 | $7,480 | $143,600 | $95,000 | $48,600 |
| 2014 | $7,326 | $143,600 | $95,000 | $48,600 |
Source: Public Records
Map
Nearby Homes