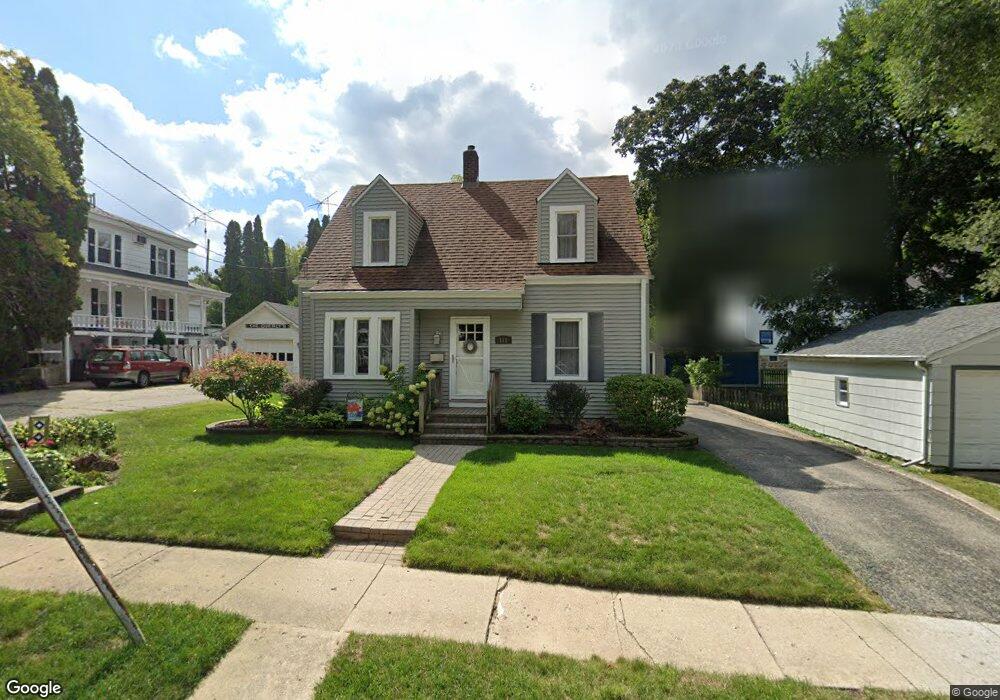
112 Fremont St Woodstock, IL 60098
Estimated Value: $208,000 - $272,000
3
Beds
2
Baths
1,044
Sq Ft
$232/Sq Ft
Est. Value
About This Home
This home is located at 112 Fremont St, Woodstock, IL 60098 and is currently estimated at $241,717, approximately $231 per square foot. 112 Fremont St is a home located in McHenry County with nearby schools including Dean Street Elementary School, Creekside Middle School, and Woodstock High School.
Ownership History
Date
Name
Owned For
Owner Type
Purchase Details
Closed on
May 7, 2015
Sold by
Laidig Jason D and Laidig Shanon D
Bought by
Laidig Mary T
Current Estimated Value
Home Financials for this Owner
Home Financials are based on the most recent Mortgage that was taken out on this home.
Original Mortgage
$113,500
Outstanding Balance
$88,810
Interest Rate
4.12%
Mortgage Type
New Conventional
Estimated Equity
$152,907
Purchase Details
Closed on
Aug 29, 2003
Sold by
Laidig Jason D and Roby Shanon D
Bought by
Laidig Jason D and Laidig Shanon D
Purchase Details
Closed on
Aug 27, 2002
Sold by
Michelsen Terry J and Michelsen Niall G
Bought by
Laidig Jason D and Roby Shanon D
Home Financials for this Owner
Home Financials are based on the most recent Mortgage that was taken out on this home.
Original Mortgage
$152,575
Interest Rate
6.56%
Mortgage Type
FHA
Purchase Details
Closed on
Aug 28, 1998
Sold by
Lile Arthur W and Lile Linda C
Bought by
Michelsen Terry J and Michelsen Niall G
Home Financials for this Owner
Home Financials are based on the most recent Mortgage that was taken out on this home.
Original Mortgage
$129,200
Interest Rate
7.06%
Create a Home Valuation Report for This Property
The Home Valuation Report is an in-depth analysis detailing your home's value as well as a comparison with similar homes in the area
Home Values in the Area
Average Home Value in this Area
Purchase History
| Date | Buyer | Sale Price | Title Company |
|---|---|---|---|
| Laidig Mary T | $130,000 | First American Title | |
| Laidig Jason D | -- | -- | |
| Laidig Jason D | $154,971 | Ticor Title Insurance Compan | |
| Michelsen Terry J | $136,000 | -- |
Source: Public Records
Mortgage History
| Date | Status | Borrower | Loan Amount |
|---|---|---|---|
| Open | Laidig Mary T | $113,500 | |
| Closed | Laidig Jason D | $152,575 | |
| Previous Owner | Michelsen Terry J | $129,200 |
Source: Public Records
Tax History Compared to Growth
Tax History
| Year | Tax Paid | Tax Assessment Tax Assessment Total Assessment is a certain percentage of the fair market value that is determined by local assessors to be the total taxable value of land and additions on the property. | Land | Improvement |
|---|---|---|---|---|
| 2024 | $4,214 | $61,742 | $8,382 | $53,360 |
| 2023 | $3,897 | $55,835 | $7,580 | $48,255 |
| 2022 | $4,511 | $54,749 | $6,727 | $48,022 |
| 2021 | $4,238 | $51,153 | $6,285 | $44,868 |
| 2020 | $4,040 | $48,606 | $5,972 | $42,634 |
| 2019 | $3,883 | $46,398 | $5,701 | $40,697 |
| 2018 | $3,457 | $42,018 | $6,504 | $35,514 |
| 2017 | $3,924 | $39,546 | $6,121 | $33,425 |
| 2016 | $3,864 | $36,617 | $5,668 | $30,949 |
| 2013 | -- | $37,145 | $8,152 | $28,993 |
Source: Public Records
Map
Nearby Homes
- 415 Dean St
- 321 Hoy Ave
- 125 Forest Ave
- 331 Chestnut St
- 104 Stewart Ave
- 330 Lake Ave
- 1249 Prairie Ridge Trail
- 4022 Meadowridge Rd
- 3857 Riverwoods Dr
- 3917 Riverwoods Dr
- 3905 Riverwoods Dr
- 3839 Riverwoods Dr
- 3845 Riverwoods Dr
- 1288 Prairie Ridge Trail
- 1253 Prairie Ridge Trail
- 1245 Prairie Ridge Trail
- Brighton Plan at Clublands of Antioch - Horizon Series
- Meadowlark Plan at Clublands of Antioch - Horizon Series
- Siena Plan at Clublands of Antioch - Andare Series
- Napa Plan at Clublands of Antioch - Andare Series