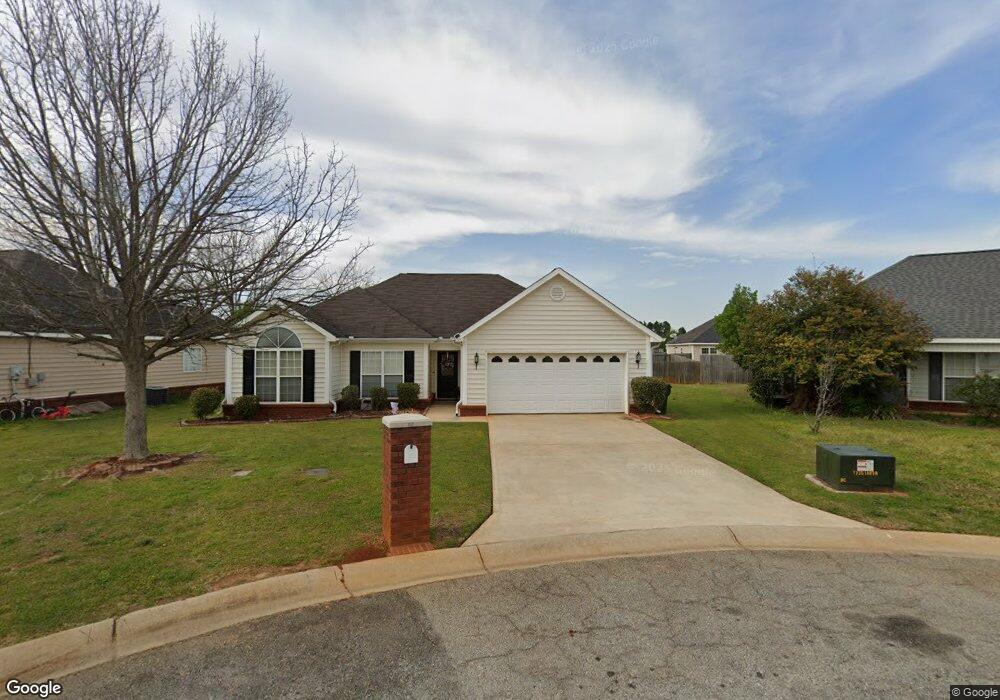
112 Gailey Ct Warner Robins, GA 31088
Estimated Value: $228,000 - $240,000
3
Beds
2
Baths
1,481
Sq Ft
$157/Sq Ft
Est. Value
About This Home
This home is located at 112 Gailey Ct, Warner Robins, GA 31088 and is currently estimated at $232,020, approximately $156 per square foot. 112 Gailey Ct is a home located in Houston County with nearby schools including David A. Perdue Primary School, David A. Perdue Elementary School, and Feagin Mill Middle School.
Ownership History
Date
Name
Owned For
Owner Type
Purchase Details
Closed on
May 30, 2017
Sold by
Evans David M
Bought by
Campbell Chastity Y
Current Estimated Value
Home Financials for this Owner
Home Financials are based on the most recent Mortgage that was taken out on this home.
Original Mortgage
$121,655
Outstanding Balance
$101,192
Interest Rate
4.02%
Mortgage Type
FHA
Estimated Equity
$130,828
Purchase Details
Closed on
Nov 30, 2009
Sold by
Honan Charles S
Bought by
Evans David M
Home Financials for this Owner
Home Financials are based on the most recent Mortgage that was taken out on this home.
Original Mortgage
$119,790
Interest Rate
4.98%
Mortgage Type
FHA
Purchase Details
Closed on
Jun 20, 2005
Sold by
Herndon Kenneth B
Bought by
Honan Charles S
Purchase Details
Closed on
Sep 12, 2003
Sold by
Jon'S Custom Homes Inc
Bought by
Herndon Kenneth B
Purchase Details
Closed on
Mar 24, 2003
Sold by
Sun King Inc
Bought by
Jon'S Custom Homes Inc
Create a Home Valuation Report for This Property
The Home Valuation Report is an in-depth analysis detailing your home's value as well as a comparison with similar homes in the area
Home Values in the Area
Average Home Value in this Area
Purchase History
| Date | Buyer | Sale Price | Title Company |
|---|---|---|---|
| Campbell Chastity Y | $123,900 | -- | |
| Evans David M | $122,000 | None Available | |
| Honan Charles S | $120,500 | -- | |
| Herndon Kenneth B | $111,000 | -- | |
| Jon'S Custom Homes Inc | $17,400 | -- |
Source: Public Records
Mortgage History
| Date | Status | Borrower | Loan Amount |
|---|---|---|---|
| Open | Campbell Chastity Y | $121,655 | |
| Previous Owner | Evans David M | $119,790 |
Source: Public Records
Tax History Compared to Growth
Tax History
| Year | Tax Paid | Tax Assessment Tax Assessment Total Assessment is a certain percentage of the fair market value that is determined by local assessors to be the total taxable value of land and additions on the property. | Land | Improvement |
|---|---|---|---|---|
| 2024 | $2,491 | $76,120 | $9,600 | $66,520 |
| 2023 | $2,130 | $64,600 | $8,800 | $55,800 |
| 2022 | $1,372 | $59,680 | $8,800 | $50,880 |
| 2021 | $1,150 | $49,760 | $8,800 | $40,960 |
| 2020 | $1,033 | $44,480 | $8,800 | $35,680 |
| 2019 | $1,033 | $44,480 | $8,800 | $35,680 |
| 2018 | $1,033 | $44,480 | $8,800 | $35,680 |
| 2017 | $1,034 | $44,480 | $8,800 | $35,680 |
| 2016 | $1,036 | $44,480 | $8,800 | $35,680 |
| 2015 | $0 | $44,480 | $8,800 | $35,680 |
| 2014 | -- | $44,480 | $8,800 | $35,680 |
| 2013 | -- | $44,480 | $8,800 | $35,680 |
Source: Public Records
Map
Nearby Homes
- 110 Gailey Ct
- 114 Gailey Ct
- 211 Melvina Dr
- 108 Gailey Ct
- 209 Melvina Dr
- 213 Melvina Dr
- 207 Melvina Dr
- 116 Gailey Ct
- 121 Gailey Ct
- 106 Gailey Ct
- 119 Gailey Ct
- 301 Melvina Dr
- 205 Melvina Dr
- 0 Melvina Dr Unit 7142127
- 0 Melvina Dr Unit 8163785
- 117 Gailey Ct
- 118 Gailey Ct
- 104 Gailey Ct
- 115 Gailey Ct
- 103 S Charity Ln